Database Reference
In-Depth Information
6
4
2
0
-2
-4
6
-6
4
-4
2
-2
0
0
-2
2
-4
-6
4
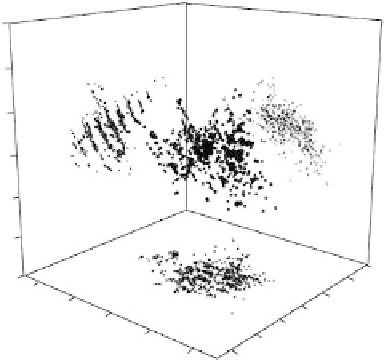
Figure 8.5
(See color insert following page 224.) A three-dimensional PCA
plot of a multivariate database of high-temperature superconductors. The
initial dataset has 600 compounds with 8 attributes each. The projections in
the PC1, PC2, and PC3 space are shown.
with data on 8 different attributes or variables associated with each compound
(i.e., the columns). These attributes include cohesive energy, pseudo-potential
radii, electronegativity, ionization energy, and valency. The PCA analysis in-
dicates that no clear pattern emerges (from visual inspection at least) unless
one looks at the PC3-PC2 projection, where a clear clustering pattern is seen.
By inspection with the original dataset, the linear clusters were found to be
associated with systematic valency changes among the compounds studied. It
should be noted that this process of inspection and data association has to be
a deliberate and careful process of understanding what data was input and
how to infer interpretations from these patterns. Automatic methods of “un-
supervised learning” and data interpretation are possible, and that is where
data-mining methods become very valuable.
83
It was a systematic association of trends in transition temperature with
the original datasets that led to the discovery that each linear cluster was
associated with a given “average valency,” a term proposed by Villars and
Phillips
84
nearly two decades ago. In other words, all the compounds in this
score plot cluster according to this hypothesis. Given that the data used by
Villars and Phillips just precedes the discovery of ceramic superconductors,
our work, which includes data since then, demonstrates the broader impact of
the valency-clustering criterion in superconductors. As shown in Figure 8.6,
that also helps in providing a physical interpretation of trajectories in PCA
space. For instance PC2 and PC3 represent orthogonal projections of the
“valency vector” effect on high Tc superconductors as it is approximately at
45 degrees to the principal component axes. While the PC axes themselves in