Geoscience Reference
In-Depth Information
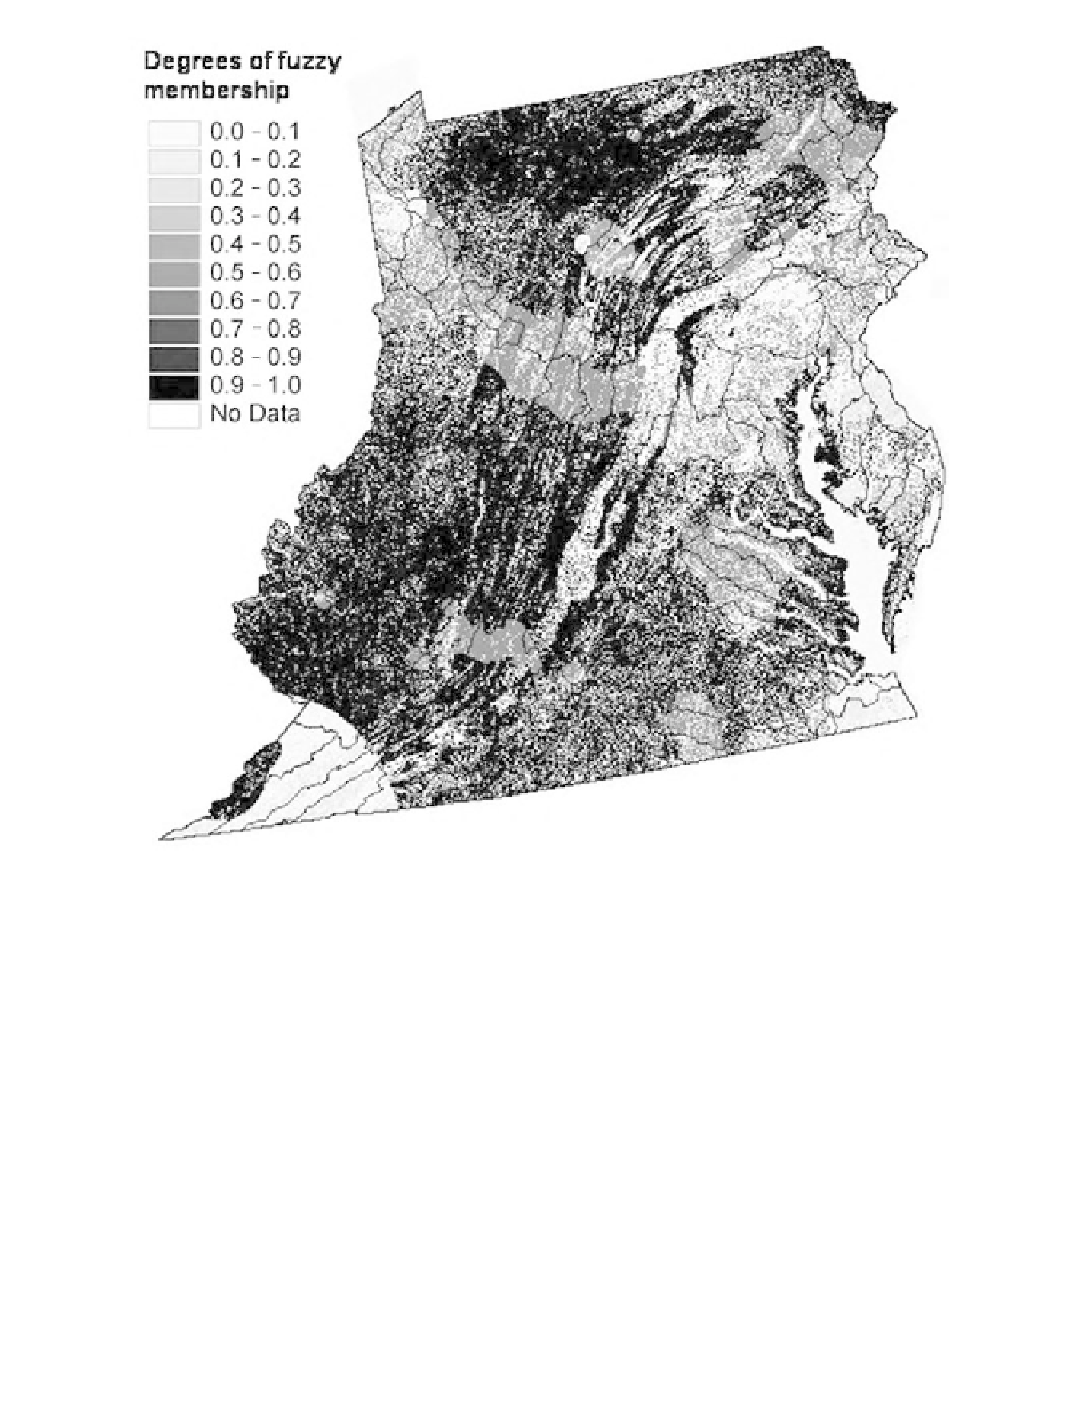
Figure 13.4
Fuzzy forested upland map.
pattern as the degree of membership of a cover type reclassified as forested upland at each location
on a map was decided by the dominance and accuracy of that cover type at that spot. Figure 13.4
shows the fuzzy forested upland map that was a combination of the six cover type conversion
maps
(Figure 13.3). An abnormality in the southwestern corner of Virginia apparently resulted from a
very low level of accuracy for most of the forest upland sampled pixels in the vicinity. This made
the forested upland degrees of membership for this area very low, although the area was dominated
by forest. This irregularity can be verified only through the additional reference data. For other
forested areas with low accuracy levels, like southern Pennsylvania, the degrees of membership
were greater (around 0.5 to 0.6). This value implies that a forested upland-labeled pixel in such an
area has a low probability (0.1 to 0.2) of being another cover type (i.e., herbaceous planted/cultivated
or developed).
Figure 13.5a-d presents the crisp binary map and three a-cut maps of the fuzzy forested upland
map at the levels of 0.1, 0.25, and 0.5. One can see that the 0.1-cut forested upland map (b) had
more forest than the crisp binary map (a) in all areas other than southwestern Virginia. This result
is because the 0.1-cut map included pixels that were labeled to other cover types but had possibilities
> 0.1 of being forested upland. This was somewhat similar to the result if a rule to include only