Geoscience Reference
In-Depth Information
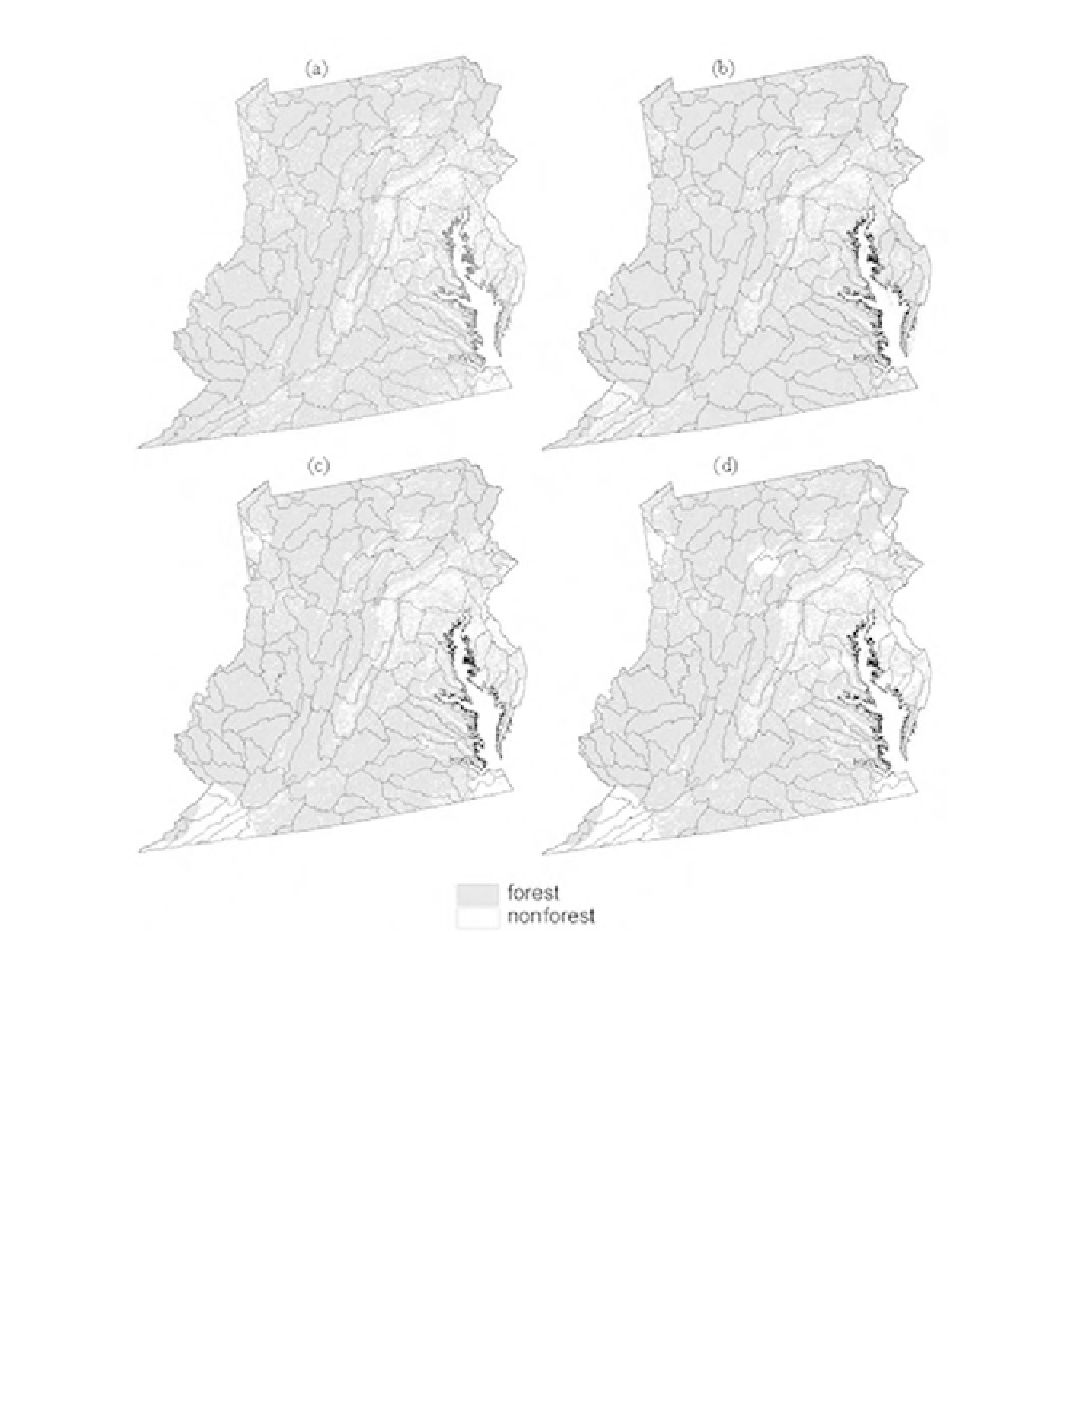
Figure 13.5
Crisp binary forested upland map (a) and three
a
-cut maps derived from the fuzzy forested upland
map: (b) 0.1-cut, (c) 0.25-cut, and (d) 0.5-cut.
the forested upland omission errors into the forested upland category had been used. Conversely,
the 0.25-cut forested upland map (c) appeared to be similar to the crisp binary map in terms of
forest coverage. This can be explained by the fact that only pixels with moderate forested upland
degrees of membership (> 0.25) were included in the 0.25-cut map. This excluded the forested
upland omission errors but maintained the commission errors. For the 0.50-cut map (d), forest
coverage was proportionately less than on the binary map and areas with low forest accuracy were
excluded from the map. By exploring various a-cut maps of forested upland, the different forested
upland map outcomes can be explored including and/or excluding omission and commission errors.
Table 13.4 presents two forested landscape indicators (FOR% and INT20) for 10 watersheds in
MAR (Figure 13.5). FOR% was computed to extract the number of pixels with forested upland cover
on a watershed basis divided by the total number of pixels for each watershed to yield the watershed-
based index value. INT20 was used to calculate the proportion of forested upland cover within each