Geoscience Reference
In-Depth Information
Table 14.19
Loss function, in $/ton
True grade is waste
True grade is leach ore
Estimated grade is waste
A
11
=
0
A
12
= -G/A Costs -{Leach Revenues—Proc.
Costs}
Estimated grade is leach ore
A
21
= {Waste Revenues—Proc. Costs}—G/A
Costs
A
22
=
0
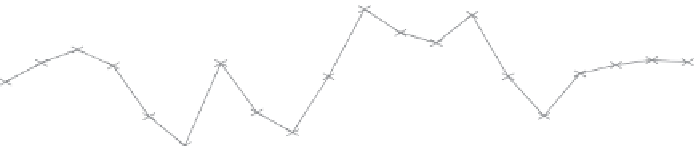
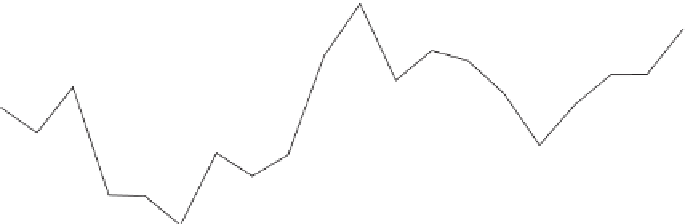
Fig. 14.59
Comparison of grade
control to Resource Model (
F
1
factors), San Cristóbal, August
1994-March 1996
*UDGH&RQWURO0HWKRGV3HUIRUPDQFH
3RO\JRQDOYV05
3RO\JRQDO*UDGH&RQWURO
05*UDGH&RQWURO
$XJ 2FW 'HF )HE $SU -XQ $XJ 2FW 'HF )HE
0RQWK
)7RQV
)*UDGH
)2XQFHV
3. The codes within each blast were visualized on screen
and a polygon is drawn to define areas of ore and waste.
This polygon was drawn manually by the grade control
technician following operational constraints.
4. The MR grade control method was based on a geological
model. This is necessary because the conditional simu-
lations do not capture sharp mineralogical or structural
transitions. The MR method is no different than any other
grade control method in that it will only produce good
results if properly controlled with in-pit mapping and a
geologic model.
5. An estimate is generally required for the tons and grade
to be recovered from each blast. At San Cristóbal the av-
erage grade of the simulations was used as the estimated
grade for each panel.
Note that the decision of where to send each block or portion
of the blast is made before any actual estimate of the grade
is obtained. The decision only depends on the relative prob-
abilities of each block of belonging to either the ore or waste
category, and the potential cost of making a mistake.
An
F
1
factor is defined to compare block model results
to grade control results. An
F
2
factor is used to compare
“loaded to heap” material to grade control predictions, as
proposed by Parker (Rossi and Parker
1993
). The
F
3
factor
(
F
3
=
F
1
*
F
2
) is used to compare tons and grade predicted by
the long-term block model (MIK) to tons and grade loaded
to heaps.
Figure
14.59
shows the
F
1
factors for the period, on a
monthly basis; the introduction of the maximum revenue
grade control method is evident. This was the only change
introduced in the operation at the time. Table
14.20
shows the
improvements achieved with the MR method. It compares
over a 13-month period the tonnages, grades, and ounces
predicted by the MIK block model to the tonnages, grades
and ounces selected by the two grade control methods.
The
F
2
factors averaged for the 13-month period in
Table
14.20
reflect tonnages actually selected and loaded to
the plant using the conditional simulation method. A 10 % un-
planned dilution in ounces in an operation with an extremely
erratic mineralization is quite reasonable. Polygonal-based
method results in dig panels that make loading and selection
in the pit much more difficult, which would make the result-
ing
F
2
factors for the polygonal method even worse. The fine
grid used by the MR method allows for an operational cut
that incorporates less dilution. Another important conclusion
is that in reality the Long-term block model (MIK) was con-
servative in tons and about unbiased in grade, and most of its
perceived shortcomings were not in fact an issue.
14.6.4
Results
From March 1995 through March 1996 the operation imple-
mented in parallel the existing polygonal and the new MR
methods, allowing for a direct comparison based on produc-
tion. The comparison demonstrated the remarkable improve-
ment achieved by the MR method.