Geoscience Reference
In-Depth Information
The MR method is based on using blast hole data to ob-
tain blast simulations. These simulations are processed using
a loss function defined in terms of the operating profit as:
Loss
=
Actual
−
Potential
The revenue equation, usually expressed on per ton of ore
basis, is given by:
(
) (
) (
)
Profit = Price
•
Metallurgical Recovery
•
Au grade
(
)
−
Treatment Costs + G&A Costs
The revenue function should include at least processing costs,
and general and administration costs (G/A) assigned to the
operation. Some mining companies assign to the mine other
costs such as capital replacement and depreciation costs, or
brownfield or greenfield exploration costs. This artificially in-
creases the breakeven cutoff, which may be appropriate if the
mill capacity is limited. In general, mining costs should not be
included, since the blasted material will have to be moved re-
gardless of its destination, that is, it is a sunk cost. Only if there
are differences in transportation costs for different destinations
(waste and ore) a differential mining cost term should appear.
A matrix can be built based on the alternative material
destinations. In this case, only waste and leach ore have been
considered; therefore, a 2 × 2 loss function matrix is obtained.
Extending this matrix to multiple destinations, such as mill
and stockpiles, is straightforward. The miss-classification
matrix quantifies the cost in dollars of each possible mis-
take. Table
14.19
presents the simplest possible Loss Func-
tion corresponding to ore and waste destinations, which was
used at San Cristóbal.
The diagonal cells in Table
14.19
are 0 because in those
cases the right decision is made, i.e., there is no loss. Cell
A
21
represents the loss incurred when waste material is sent
to the processing facility, in this case the leach pad. The po-
tential benefit is negative (since the true grade is waste), the
only cost that should have been incurred into is the G/A cost
of operating the mine; a loss is added to the potential operat-
ing profit, stemming from the processing of waste material.
Cell A
12
presents the case where material that is ore is sent
to the waste dump. The potential benefit is the revenue that
would have been achieved if the right decision was made.
The resulting loss in both cases is a negative dollar amount
taking into account the actual and the opportunity costs.
The MR grade control method as implemented at San
Cristóbal consists of the following steps:
1. Conditional simulations were obtained based on nearby
blast holes. These conditional simulations provide the
probability for each specific block to be either ore or waste.
2. Apply the loss function as defined in Table
14.19
. The
blocks were assigned a series of codes (waste or ore) rep-
resenting the optimal selection in an economic sense.
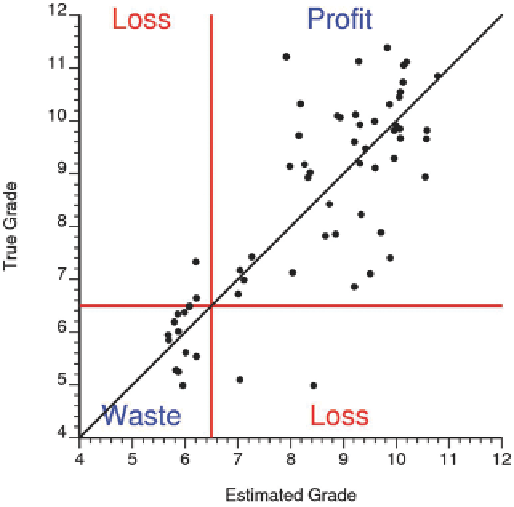
Fig. 14.58
Misclassification in grade control
14.6.3
Implementation of the MR Method
The work summarized here was initiated because the opera-
tion achieved poor grade and tonnage reconciliations for a
number of years. The block model used for long-term mine
planning was blamed for the problem. Several attempts were
made to improve the resource model, and in the end the MIK
model was believed to be as good a model as the drill hole
data and the geologic knowledge would allow. Then, atten-
tion was turned to grade control, since the mineralization's
variability at San Cristóbal was a significant challenge to the
day-to-day operation, determining its operating profitability.
The existing grade control method was based on assign-
ment of blast hole grades to panels. The blast holes were plot-
ted on scaled maps; mine technicians would then draw poly-
gons based on the observed grades at each blast hole; and then
visually define areas of ore to be extracted. These maps with
the polygons were passed on to the surveyors, who would
then stake on the pit the ore and waste areas for the operators
to load. The predicted average grade of the panel was calcu-
lated as a simple arithmetic average of all blast hole grades
within the panel. A dilution band of 1 or 2 m. was added,
estimating its grade by averaging surrounding blast holes.
Then, the overall grade of the polygon was estimated as an
area-weighted average of the ore zone and the dilution zone.
The case study described here details the changes intro-
duced in the grade control method over a 13-month evalu-
ation period from March 1995 to March 1996. All other
aspects of grade control, including blast hole sampling, da-
tabase creation, blasting practices, field demarcation, and
operating practices were not affected by the change in grade
control method.