Geoscience Reference
In-Depth Information
nary Feasibility Study. This Study must include adequate
information on mining, processing, metallurgical, economic,
and other relevant factors that demonstrate, at the time of
reporting, that economic extraction can be justified.
Reporting Codes and corresponding Guidelines use
vague language in its definitions, as it is difficult to provide a
general Guideline applicable to all different types of mineral
deposits and resource estimation practices. There is a gen-
eral tendency to suggest the use of some form of statistical
description of uncertainty, if only as an accompanying tool
that would clarify the degree of uncertainty.
All guidelines discuss geologic and grade continuity as
key components of the classification criteria, sometimes add-
ing modifying factors to adjust to local conditions. It is the
QP's decision as to what an acceptable evidence of that con-
tinuity is, which may be partly dependent on the QP's prior
experience with that type of deposits. In practice, resource
classification is often reduced to deciding the criteria to be
applied, including continuity, and then finding a method to
classify the resources that best captures that basic criteria. A
common misconception is that resource classification meth-
ods provide an objective assessment of confidence; in fact,
the classification is an expression of a QP's opinion.
A common practice is to use some form of distance of
drill holes to the estimated blocks. The choice of geometric
criteria should be based on common practice for the deposit
type, site-specific considerations and an expert judgment of
other factors. The benefits of using simple distance measures
are that the criteria can be simply stated, it is a transparent
and easy-to-understand process, and leaves little room for
mischief. Also, it does not depend on the estimation method
chosen. Some of the most common concerns stated against
these types of methods are that they are overly simplistic, as
they fail to fully capture geologic confidence.
Geometric methods for classification generally do not
give an actual measure of uncertainty, and if so, only for very
large volumes, as with the kriging variance. There is an in-
creasing interest in quantifying uncertainty at different vol-
umes (block by block, if possible), which leads to relevant
risk assessments.
Other alternatives encountered in practice include krig-
ing variances, commonly applied early on in geostatistical
resource estimation (Blackwell
1998
; Diehl and David
1982
;
Froidevaux
1982
; Royle
1977
); a combination of distances
to drill holes (in a certain pattern); the number of drill holes
used to estimate each block; multiple-pass kriging estima-
tion plans to account for density of information and other
geologic factors; and possible combinations of these, as well
as hand-contouring and smoothing, usually as a post-pro-
cessing step to any of the above.
There has been a move toward systematic and standard
methods to evaluate and present uncertainty (Dohm
2005
).
Common aspects of uncertainty reporting include specifica-
tion of the population or sample being considered, measure
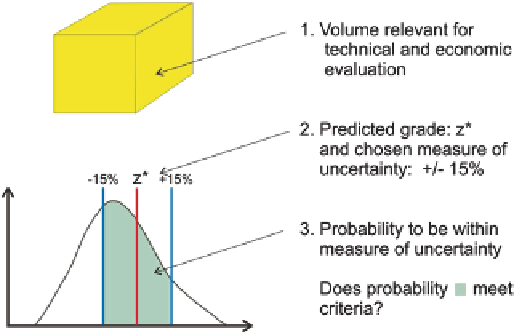
Fig. 12.6
Schematic illustration of the three parameters often used in
probabilistic classification schemes: (1) volume related to a produc-
tion period, (2) precision, and (3) probability to be within the specified
precision
of the “ + /-” uncertainty, probability to be withing the “ + /-”
measure of uncertainty, and a list of assumptions and com-
ponents of uncertainty. There are three aspects to consider in
resource classification. They are volume, measure of “ + /-”
uncertainty, and probability to be within the “ + /-” measure
of uncertainty. The format for uncertainty reporting is clear
and understandable. For example, H.M. Parker (personal
comminucation) proposes to classify as measured resources
those monthly production volumes for which the true grade
is predicted to be within 15 % of the estimated grade 90 % of
the time. Quarterly production volumes where the true grade
will be within 15 % of the predicted grade 90 % of the time
are defined as indicated. There are no established rules or
guidelines to decide on these three parameters; this remains
in the hands of the qualified person.
Figure
12.6
highlights the three parameters often used in
probabilistic classification schemes: (1) volume related to
a production period, typically a month or a quarter, (2) the
required precision, and (3) the probability to be within the
specified precision. The volume need not be a contiguous
block, but for simplicity it is often chosen as a simple vol-
ume. This can be a significant limitation, because production
for any given period will generally come from different areas
of the mine, areas that will likely present different geological
characteristics, and have been estimated with uneven uncer-
tainty. The second two parameters summarize uncertainty,
which can be understood as proportions over a defined
population. The probabilistic statement that
there is a 90 %
probability that the grade of a monthly production volume
be within 15 % of the estimated grade
means that 90 out of
100 true grades of similarly classified monthly production
volumes will be within their estimate plus or minus 15 %.
Another alternative is to fix the volume of interest, for ex-
ample a quarter's production, and then decrease the number
of times the true value is expected to fall within the intervals,
as shown in the schematic of Fig.
12.7
. In this figure measured