Geoscience Reference
In-Depth Information
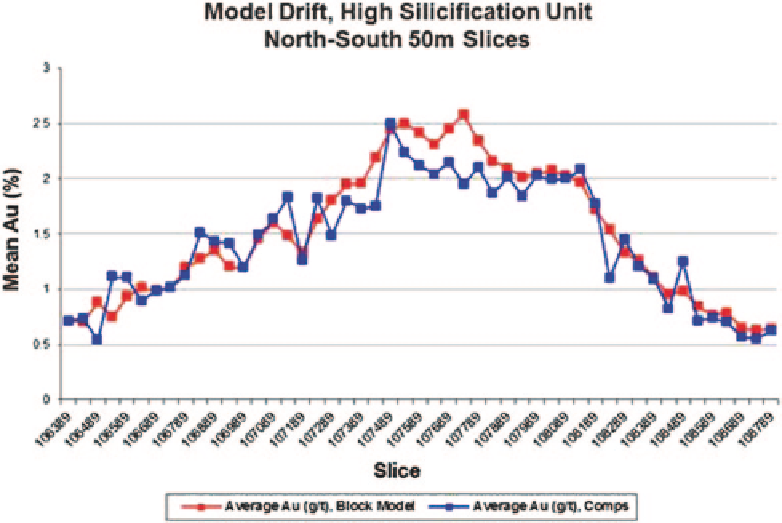
Fig. 11.4
North-South trend
of Au grades (%), 50 m slices
The histograms and basic statistics may be compared to
the original, declustered drill hole data used to estimate the
grades for each domain. This is to check, among other as-
pects, that the overall means (without applying a cutoff) are
very similar, since the estimated grades should be unbiased.
Also, the shape of the histogram can provide clues as to the
quality of the estimation, in particular if the domain con-
sidered is not strictly stationary, with discontinuities in the
grade population. Sometimes, a peculiar composite selection
method at the time of estimation may cause artifacts on the
shape of the histogram of estimated grades, such as creating
artificial boundaries. Because of this, it is convenient to al-
ways look at the frequency distribution of estimated grades,
not just a box plot or a table of main statistics.
It is also important to check the grade trends as observed
in the data compared to the model. This can be accomplished
by plotting declustered drill hole grades vs. block model aver-
ages based on the three main Cartesian coordinates, and con-
sidering significantly large volumes at a time. Slices or swaths
are usually defined for each main direction. The swath width
should be large enough to provide reasonable estimates of the
average declustered grade for the slice, which is approximated
usually with a NN estimate. Figure
11.4
shows an example.
Another important aspect that the resource model should
adequately reproduce is the behavior of grades near contact
zones. The model should be checked to ensure that the grade
profiles near contacts are reproduced, based on the conditions
imposed at the time of estimating. This involves producing
contact profiles from the resource model. One such compari-
son is shown in Fig.
11.5
. Note that the block model grades
are somewhat smoothed near the contact, and tend to margin-
ally over-predict the grades of Unit 5 while under-predicting
the grades of Unit 6. This type of comparison should not be
analyzed in isolation, rather as one more piece of the puzzle
before deciding to either iterate the grade estimation process
changing some parameters, or accepting the model as is.
One of the most important issues to be assessed is an
evaluation of the degree of smoothing and conditional bias
in the block model, and how it compares to the expected or
theoretical smoothing of the actual or planned operation.
Excessive smoothing of the model grades amounts to too
much internal dilution being added to the model. By using
geostatistcal models to predict the expected internal dilution
(volume-variance effect), the amount of internal dilution ex-
pected for a given Selective Mining Unit (SMU) can be pre-
dicted. Therefore, a target or reference grade-tonnage curve
can be developed to validate the resource model.
Table
11.1
shows the comparison of the predicted SMU
distribution vs. the grade model in terms of means and
coefficient of variations, while Fig.
11.6
shows a grade-
tonnage curve where both the predicted SMU and the es-
timated grade model are compared. Notice that, for most
cutoffs, the grade model appears to predict slightly higher
tonnage and lower grade than predicted for the SMU dis-
tribution. In most cases, small differences such as the ones
shown are acceptable since the resource model should in-
corporate other types of dilution, not just within-block, or
internal, dilution.
11.4.3
Graphical Validation
It is always good practice to visualize graphically the model
obtained using an appropriate scale to observe both the data