Geoscience Reference
In-Depth Information
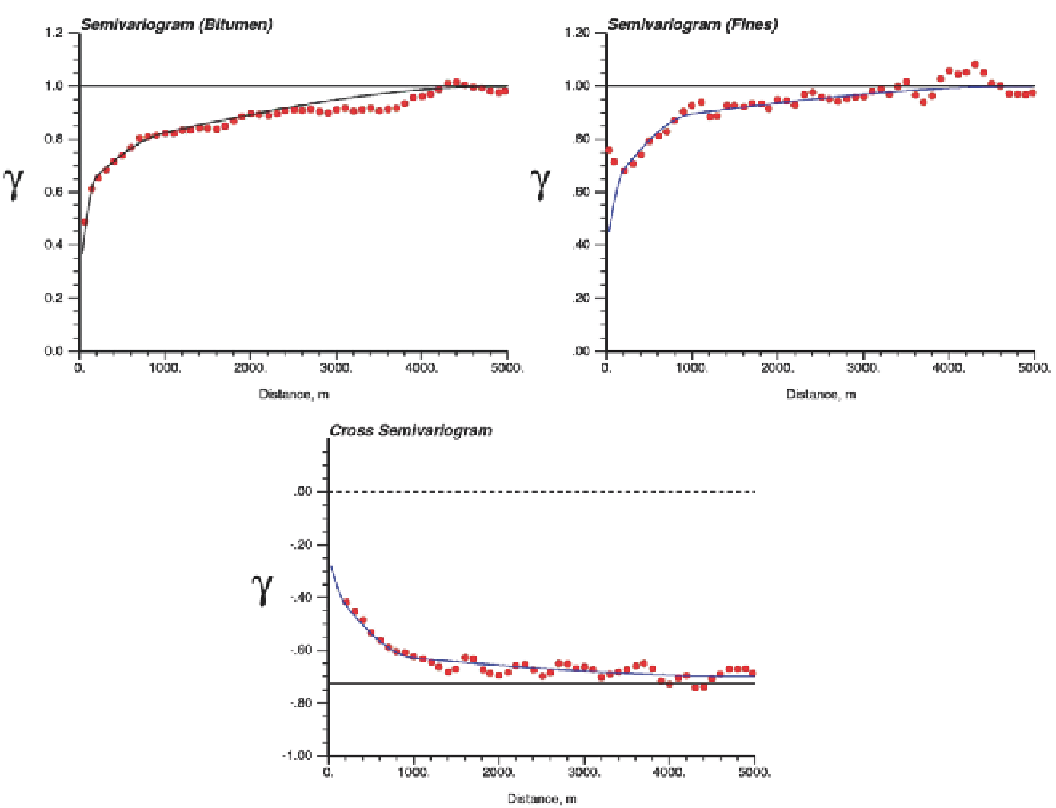
Fig. 6.12
Example direct and cross variograms for an oil sands deposit in the most continuous direction. The direct variograms are shown at the
top
and the cross variogram is shown
below
data limitations encountered, and the possible artifacts that
result from the data. The process of definition of the model
should also be explained in detail.
In addition, good practice requires a more detailed explor-
atory variogram analysis upfront. All relevant data in each
estimation domain should be analyzed and used if possible.
The definition of relative nugget effects, the models chosen,
the anisotropies encountered and how they were modeled, as
well as a discussion on the alternatives should be made. In
addition, it requires detailed understanding of the uncertainty
sources for the resulting models. Alternative models should
be tried for the most important estimation domain, and suf-
ficient checks made to have a high degree of confidence on
the final model. The description of the variogram models in
terms of its geologic significance should be detailed and un-
ambiguous, and all aspects of the model should be demon-
strated in terms of geologic factors, and not data artifacts. All
the work should be well documented and presented, detail-
ing the quality control procedures in place.
Best practice includes, in addition to the aspects discussed
above, the use of all possible geologic, grade, and other an-
cillary data to obtain the variogram models. Exhaustive ex-
ploratory variogram analysis should be done, leaving no pa-
rameter or aspect of the model without analysis and justifica-
tion, and different issues such as data qualities and different
data supports analyzed and justified accordingly. All poten-
tial sources of variogram model uncertainty should be quan-
tified, and discussions on possible and relevant cross valida-
tion and re-sampling should be presented. The models should
be presented both mathematically as well as graphically.
6.6
Exercises
The objective of this exercise is to calculate, interpret, and
model variograms. Some specific (geo)statistical software
may be required. The functionality may be available in dif-
ferent public domain or commercial software. Please acquire