Information Technology Reference
In-Depth Information
1
0.9
0.8
0.7
0.6
0.5
0.4
0.3
0.2
0.1
0
0
0.1
0.2
0.3
0.4
0.5
0.6
0.7
0.8
0.9
1
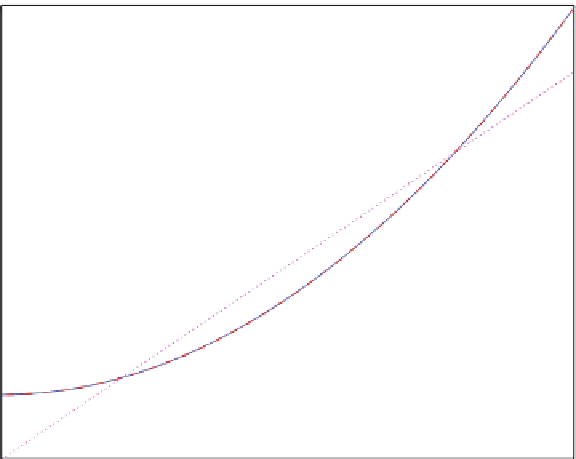
1
10
cos.t / (
solid curve
) and its least squares approximations:
constant (
dashed line
), linear (
dotted line
) and quadratic (
dash-dotted curve
)
t
2
Fig. 5.20
The function y.t/
D
C
Function 3
Let
1
10
cos.t /
y.t/
D
t
2
C
be defined on 0
t
1.Then
p
0
.t /
0:417;
p
1
.t /
0:059
C
0:953 t;
p
2
.t /
0:100
0:004 t
C
0:957 t
2
and
denote the constant, linear and quadratic least squares approximations; see Fig.
5.20
.
In this case, it is hard to distinguish between p
2
and y. This is not surprising, since
y is dominated by t
2
.
5.4
Exercises
Exercise 5.1.
Consider the data set
t
i
5 6 7
y
i
8 4 0