Information Technology Reference
In-Depth Information
1
0.8
0.6
0.4
0.2
0
0
0.5
1
1.5
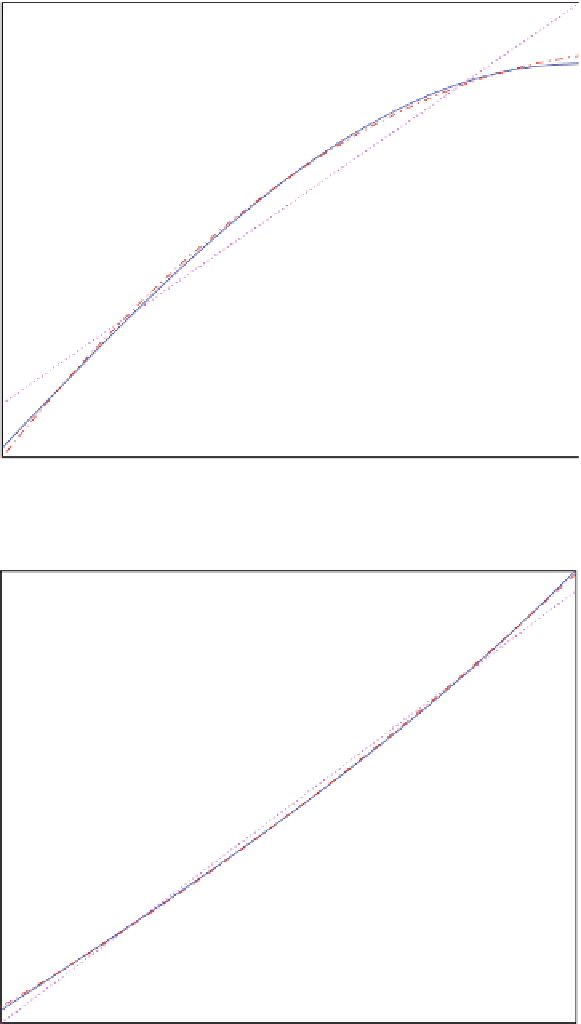
Fig. 5.18
D
sin.t / (
solid curve
) and its least squares approximations: constant
(
dashed line
), linear (
dotted line
) and quadratic (
dash-dotted curve
)
The function y.t/
2
1.5
1
0.5
0
0
0.1
0.2
0.3
0.4
0.5
0.6
0.7
0.8
0.9
1
e
t
(
solid curve
) and its least squares approximations:
constant (
dashed line
), linear (
dotted line
) and quadratic (
dash-dotted curve
)
e
t
Fig. 5.19
The function y.t/
D