Game Development Reference
In-Depth Information
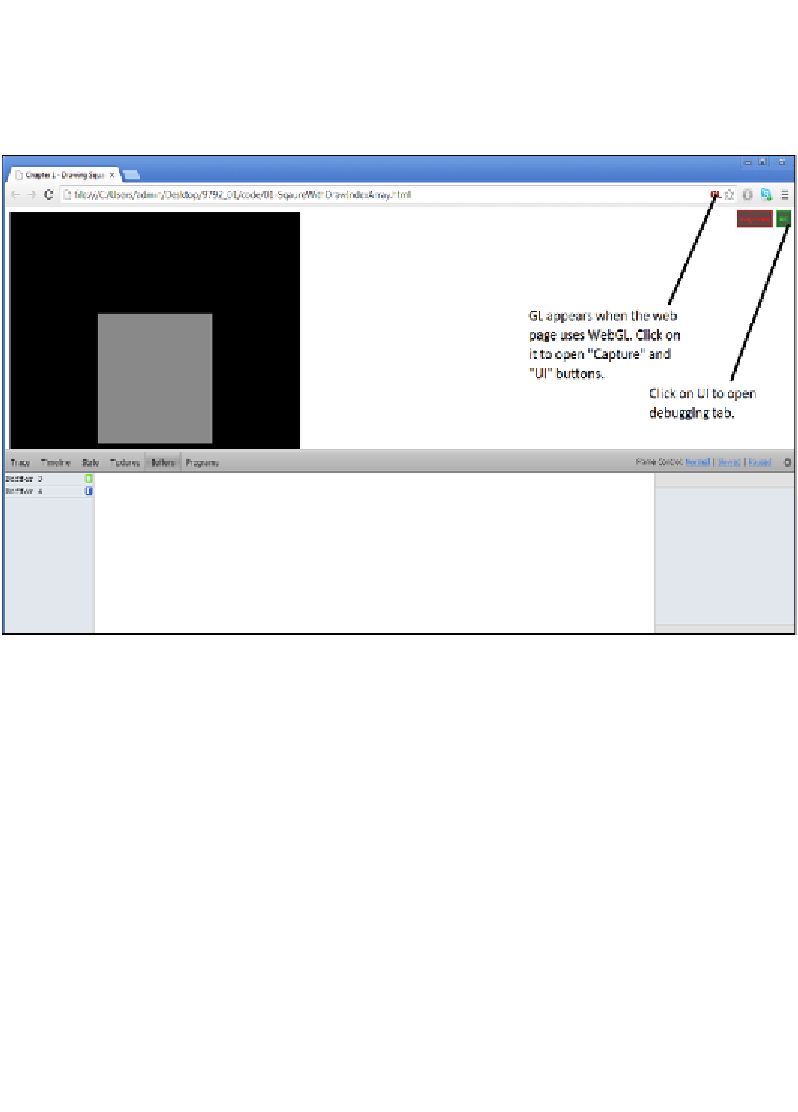
This extension helps debug, diagnose, and explore WebGL games. After enabling it,
whenever we render any WebGL scene, a tag GL will appear on the address bar on
the right-hand side. When we click on it, two tabs,
Capture
and
UI
, appear on the
right-hand side of the screen. The
UI
tab opens the debugging window, as shown in
the following screenshot:
The debugging window shows us complete information about the buffers, textures,
and variable state of the application.
Summary
In this chapter, we got to grips with basic terms such as vertices, indices, vectors,
and mesh. We covered a very basic shader and rendered a square using the simple
WebGL API. We covered basic variable qualifiers (attribute, uniform, and varying)
of the shader language. We covered the basics of loading and compiling a shader
program. The core concept of allocating a buffer (vertex buffer objects and index
buffer objects) and the processing of attributes in a shader was also covered.
We also discussed components of the WebGL's rendering pipeline, such as vertex
shaders, the rasterizer, and fragment shaders.
In the next chapter, we will improve our shader by adding light and material to the
objects in the scene.