Game Development Reference
In-Depth Information
setMatrixUniforms();
gl.bindBuffer(gl.ELEMENT_ARRAY_BUFFER, indexBuffer);
gl.drawElements(gl.TRIANGLES, indices.length,
gl.UNSIGNED_SHORT,0);
}
In the
drawscene()
function, we make the
indexBuffer
parameter our current
g1.ELEMENT_ARRAY_BUFFER
constant. Then, we use a
drawElements()
function
with the
TRIANGLES
mode option.
Debugging a WebGL application
A WebGL application is divided into control code and shader code. We can easily
debug the control code using a simple JavaScript API,
console.log(canvas)
.
The JavaScript API
console.log()
is not compatible with some browsers, but you
can use the wrapper library at
https://code.google.com/p/console-js/
for
usage across browsers.
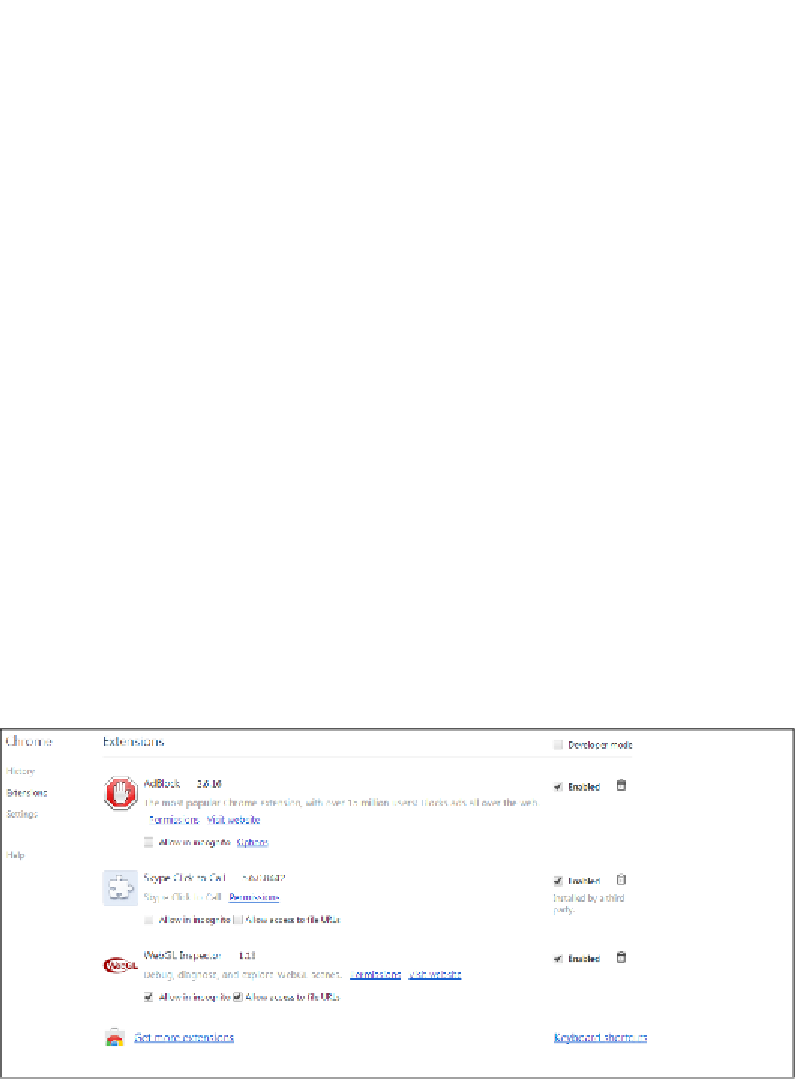
We cannot debug a shader code with a simple JavaScript API. If something goes
wrong, all we would see is a black window. Fortunately for us, there is a great
Chrome extension named WebGL inspector (
http://benvanik.github.io/WebGL-
Inspector/
) to help us debug our applications.
Simply install the extension in Google Chrome from
https://chrome.google.com/
webstore/detail/webgl-inspector/ogkcjmbhnfmlnielkjhedpcjomeaghda
. We
can enable the extension in the
Settings
menu in Google Chrome. Please refer to the
following screenshot: