Biology Reference
In-Depth Information
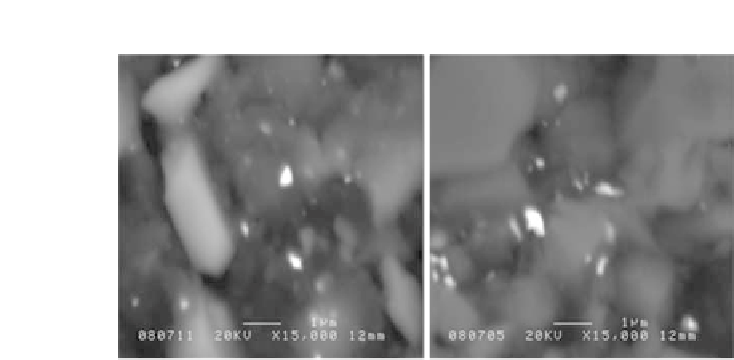
Figure 3.9.
High-resolution (1
−
μ
m) SEM microphotographs showing the
isolated gold nanoparticles on the surface of nanoAu-GEC sensors, acceler-
ation voltage, 20 kV.
the aggregates of gold NPs for nanoAu(7.5%)-GEC, which appear to
be in increased frequency when increasing the percentage of gold
NPs until nanoAu(100%)-EC. However, high-resolution SEM micro-
graphs for nanoAu(7.5%)-GEC (Fig. 3.9) show clearly isolated gold
NPs of about 100 nm within the composite, demonstrated with
the EDX detector providing the characteristic gold x-ray spectrum.
Moreover,theavailabilityofgoldNPsinthecompositefortheimmo-
bilization of thiolated oligos was also studied with fluorescence
stereomicroscopy.Inthiscase,200pmolofdouble-taggedoligowith
both a thiolated 5
end and the fluorescein 3
end was immobi-
lized on the electrodes with different composition. As can be seen
inFig.3.8,anincreasingamountoffluorescencewasobtainedwitha
higheramountofgoldNPsinthecomposite.Thefluorescenceshows
a discontinuous pattern as fluorescence dots of chemisorbing mate-
rial surrounded by nonreactive graphite-epoxy composite, except in
the case of nanoAu(100%)-EC, in which a continuous fluorescence
pattern is clearly observed. Moreover, it should be pointed out that
the fluorescence can be related with the isolated gold NP pattern
because it is not located in the aggregate zones, when comparing
with the same photos taken with the stereomicroscope without the
fluorescence filter (Fig. 3.8, third column). Thereby, the nanome-
ter scale of gold NPs seems also to play a role in the chemisorbing