Biology Reference
In-Depth Information
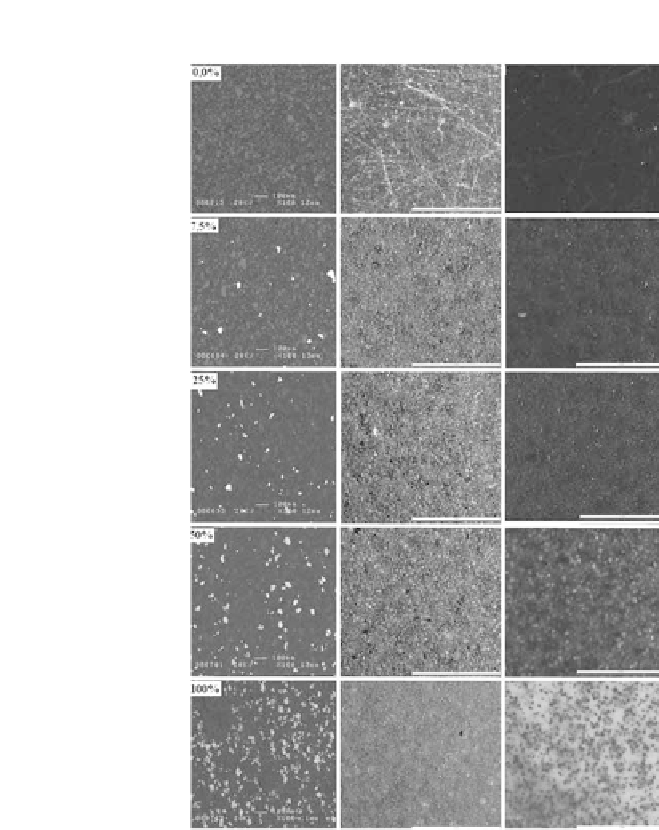
Figure 3.8.
Microscopic characterization of nanoAu-GEC electrodes.
Microphotographs showing the distribution of gold nanoparticles on the
surface of nanoAu-GEC electrodes while increasing the amount of gold
nanoparticles from 0 to 100% of the conductive phase. First column, low-
resolution (100
μ
m) SEM with an EDX detector to identify gold element.
Acceleration voltage, 20 kV. Second column, fluorescence stereomicroscopy
atlowresolutionshowingthefluorescencepatternofthedifferentnanoAu-
GEC electrodes after the immobilization of 200 pmol of double tagged oligo
with thiol and fluorescein. Third column, stereomicroscopy without the flu-
orescence filter (Fig. 3.8, third column). See also Color Insert.