Geography Reference
In-Depth Information
Figure A.3
Numbering of
grid lines.
© H. J. de Blij, P. O. Muller, and
John Wiley & Sons, Inc.
Lat 90°N
Lat 20°N
9
0
° North Pole
Lat 0°
D
D
parallel midway between the equator and the pole, thus,
is 45
in fact, many popular atlas maps (Mercator also intro-
duced the term atlas to describe a collection of maps) and
wall maps still use a Mercator for such purposes. The
National Geographic Society published its world maps
on a Mercator projection until 1988, when it fi nally aban-
doned the practice in favor of a projection developed by
the American cartographer Arthur Robinson (Fig. A.5).
During the news conference at which the change was an-
nounced, a questioner rose to pursue a point: Why had
the Society waited so long to make this change? Was it
because the distortion inherent in the Mercator projec-
tion made American and European middle-latitude coun-
tries large, compared to tropical countries in Africa and
elsewhere? Although that was not the goal of the National
Geographic Society, the questioner clearly understood
the misleading subtleties inherent even in so apparently
neutral a device as a map projection.
The Mercator projection is one of a group of pro-
jections called cylindrical projections. Imagine the globe's
lines of latitude and longitude represented by a wire grid,
at the center of which we place a bright light. Wrap a piece
of photographic paper around the wire grid, extending it
well beyond the north and south poles, fl ash the bulb, and
the photographic image will be that of a Mercator pro-
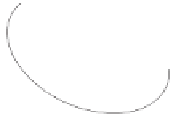
jection (Fig. A.6). We could do the same after placing a
cone-shaped of paper over each hemisphere, touching the
grid, say, at the 40th parallel north and south; the result
would be a conic projection (Fig. A.7). If we wanted a map
of North America or Europe, a form of conic projection
would be appropriate. Now the meridians do approach
each other toward the poles (unlike the Mercator projec-
tion), and there is much less shape and size distortion. And
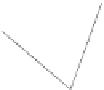
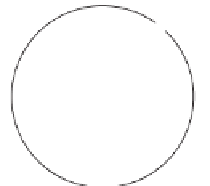
if we needed a map of Arctic and Antarctic regions, we
would place the photographic paper as a fl at sheet against
the North and South Poles. Now the photographic image
would show a set of diverging lines, as the meridians do
from each pole, and the parallels would appear as circles
(Fig. A.8). Such a planar projection is a good choice for a
map of the Arctic Ocean or the Antarctic continent.
Projections are chosen for various purposes. Just as the
Mercator is appropriate for navigation because direction is
true, other projections are designed to preserve areal size,
keep distances real, or maintain the outlines (shapes) of land-
masses and countries. Projections can be manipulated for
many needs. In this topic, we examine global distributions of
north latitude in the northern hemisphere and 45
south latitude in the southern hemisphere.
But the (vertical) longitude lines presented no such
easy solution. Among the parallels, the equator is the only
one to divide Earth into equal halves, but all meridians do
this. During the second half of the nineteenth century, maps
with confl icting numbers multiplied, and it was clear that
a solution was needed. The most powerful country at the
time was Britain, and in 1884, international agreement was
reached whereby the meridian drawn through the Royal
Observatory in Greenwich, England, would be the prime
meridian, 0
(zero degree) longitude. All meridians east
and west of the prime meridian could now be designated by
number, from 0
east and west longitude.
But what happens when these lines of latitude (paral-
lels) and longitude (meridians) are drawn to intersect at
right angles on a fl at piece of paper? At the equator, the
representation of the real world is relatively accurate. But
go toward the poles, and distortion grows with every de-
gree until, in the northern and southern higher latitudes,
the continents appear not only stretched out but also
misshaped (Fig. A.4). Because the meridians cannot be
made to converge in the polar areas, this projection makes
Antarctica look like a giant, globe-girdling landmass.
Looking at this representation of the world, you might
believe that it could serve no useful purpose. But in fact,
the Mercator projection, invented in 1569 by Gerardus
Mercator, a Flemish cartographer, had (and has) a very par-
ticular function. Because parallels and meridians cross (as
they do on the spherical globe's grid) at right angles, direc-
tion is true everywhere on this map. Thus the Mercator pro-
jection enabled navigators to maintain an accurate course at
sea simply by adhering to compass directions and plotting
straight lines. It is used for that purpose to this day.
The spatial distortion of the Mercator projection
serves to remind us that scale and projection are intercon-
nected. What scale fraction or graphic scale bar could be
used here? A scale that would be accurate at the equator
on a Mercator map would be quite inaccurate at higher
latitudes. So the distortion that is an inevitable byproduct
of any map projection also affects map scales.
One might imagine that the spatial (areal) distor-
tion of the Mercator projection is so obvious that no
one would use it to represent the world's countries. But
to 180