Biomedical Engineering Reference
In-Depth Information
8
14
12
6
10
8
4
6
4
2
2
4.9
2.0
2.8
0
1.7
3.2
0
1.8
4
3
4
2
3
1
2
0
1
0
(a)
(b)
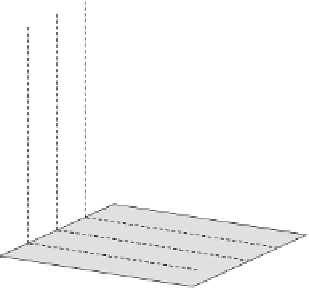
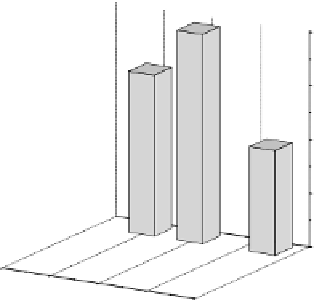
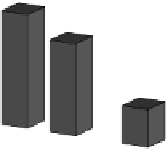
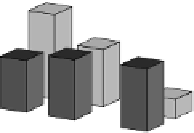
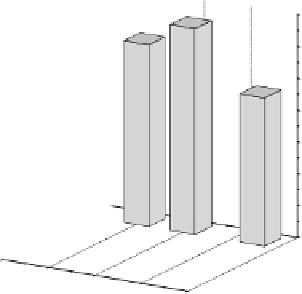
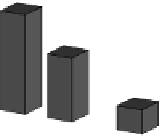
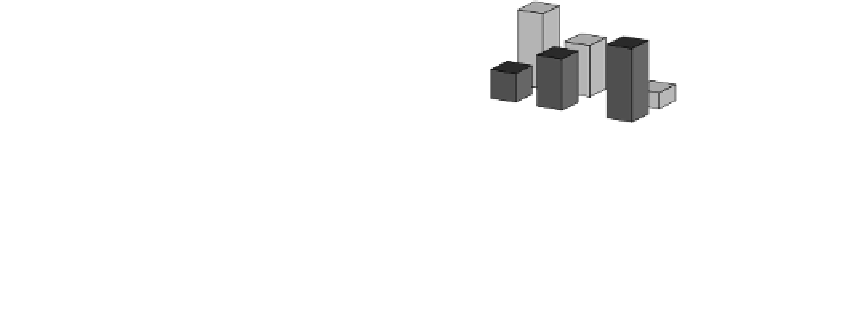
FIGURE 22.8
Diagrams showing the relationship between concentrations of hydrogen peroxide in substrate solution and spe-
cific signal to background ratio with different amounts of anti-PIV immunosorbent in each sensitive element: a
for 2.5 mg and b for 5 mg of graphite powder immunosorbent. Concentration of PIV in the sample is 100 ng/mL.
7
6
5
4
3
2
3 COV
1
Background
0
1
10
100
Para influenza virus concentration (ng/ML)
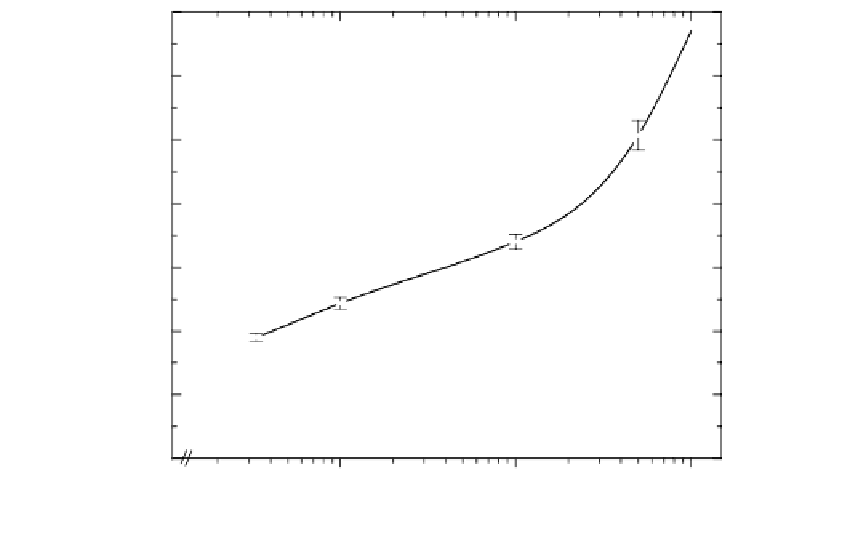
FIGURE 22.9
Determination of detection limit for parainfluenza virus (PIV) electrochemical immunoassay using three samples
for each measurement with COV of 0.06.
beginning to the end is about 22 min. The current is proportional to the concentration with
the upper limit of our device of 4
A.
Therefore, the amperometric signal in IAV is smaller than in PIV, approximately half of
the PIV values. This could be due to the outer protein shell, which is called capsid; this
comprises repeating protein subunits. The architectural arrangement of the capsid, or its
structure, as well as the presence of membranous envelope surrounding the capsid could
explain these differences.