Biomedical Engineering Reference
In-Depth Information
3.5
3.0
2.5
2.0
1.5
3 COV
1.0
Background
Detection
limit
0.5
1 10 100
Influenza A virus concentration (ng/mL)
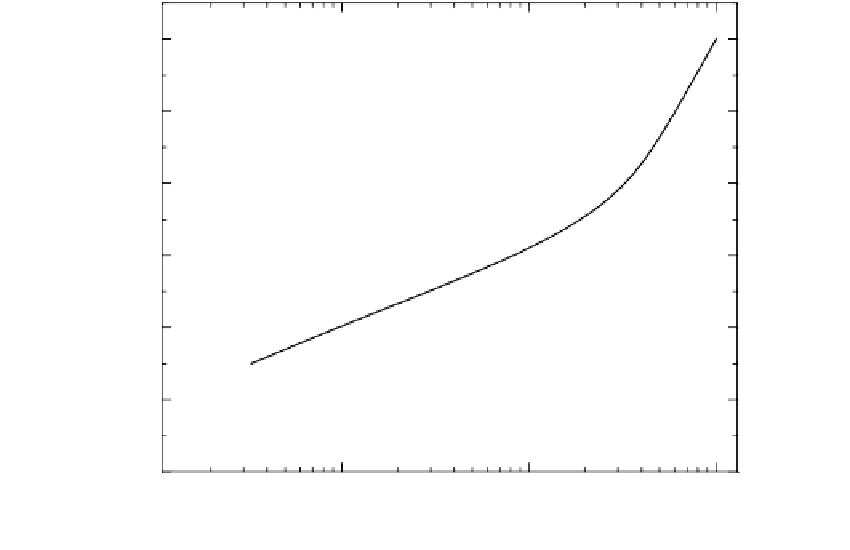
FIGURE 22.10
Calibration curve for sandwich IAV assay obtained from the flow-injection amperometric immunosensor.
Conditions of detection: flow rate is 100
L/min; the working electrodes (5 mg of graphite powder immunosor-
bent per 0.22
m pores filter) were poised at
0.125 V vs. Ag/AgCl in 0.1 M acetate BS, pH 4.5 with 0.15 M NaCl,
1 mM KI, and 0.5 mM H
2
O
2
.
4 min
Substrate
1
2
3
4
5
Injected samples with
influenza A virus
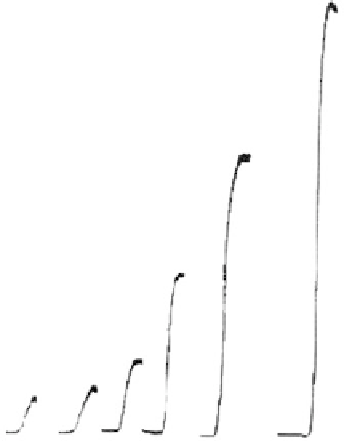
FIGURE 22.11
Sensor's response signals for different concentration of influenza A virus (IAV), ng/mL: 1, 0; 2, 2.0; 3, 30; 4, 100;
5, 300.


