Biomedical Engineering Reference
In-Depth Information
6.2.2
Multichannel Recording
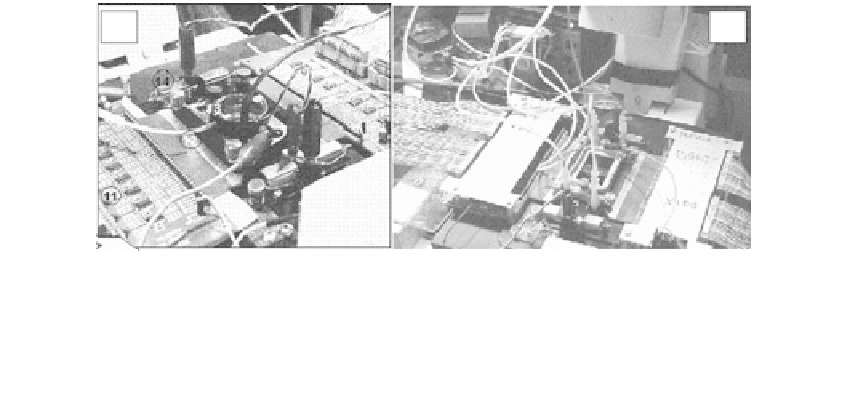
The techniques used to fabricate and prepare passive MEAs and the associated recording
chambers have been described and are well established [13, 14, 15]. A typical laboratory-
based workstation for single and dual array recording is shown in Figure 6.3. Both chambers
are interconvertible from constant-medium-volume configurations to closed-flow configura-
tions. Dual arrays feature two recording areas formed by 32 microelectrodes separated by 2.5
cm on the same 5
5 cm MEA plate with identical amplifier contact geometries (Figure 6.4).
Cruciform electrodes were incorporated to provide three deinsulation sites per conductor
(or channel) to increase the electrode yield (percent of electrodes with activity of 2:1 SNR or
higher). Although this is indeed an advantage at low cell densities (<300 neurons per square
millimeter), it causes excessive pickup at high cell densities, making the clean separation of
waveforms in real time more difficult. The two separate networks however provide twin
networks that are matched for age and maintenance schedule and allow selection of one
control and one experimental culture. This is not yet high throughput, but it paved the way
for eight-network MEAs (described in Section 6.5).
In the past decade, relatively sophisticated commercial hardware and software have
emerged for multichannel extracellular recording (Plexon Inc., Dallas; Multichannel
Systems, Reutlingen, Germany). The Plexon digital display is shown in Figure 6.5. It
allows simultaneous scanning of (1) discriminated activity on a specific channel of inter-
est, (2) time-stamp patterns from all the units discriminated,, and (3) all waveshapes dis-
criminated. A CNNS population vector display, presently based on LabView, is shown in
Figure 6.6. It depicts the average network spike and burst production per selected time
base (usually per minute) and can display the evolution of activity for continuous record-
ings over a period of days. Expansion of the
X
-axis between any two time points allows
detailed scrutiny of minute-to-minute activity changes. Such displays of simple activity
variables are invaluable to real-time monitoring and data interpretation, but can also be
used for automated data analyses using stable activity levels as reference. The dashed hor-
izontal line shows an activity recovery to near reference values and stability of network
spike and burst production over a 5-h period. The fluctuations of the minute means about
the episode mean (dashed line) provides a standard deviation (box) from which all sub-
stance-induced deviations are measured.
Burst identification is generally achieved via integration with time constants of approxi-
mately 70 ms. For digitized burst identification, a two-threshold method is used (Figure 6.7),
whereby the first threshold (T1) identifies the beginning of a putative burst, which is then
(a)
(b)
FIGURE 6.3.
Workstations for multichannel recording from networks in vitro combined with light microscopy. Chambers and
preamplifiers (32 per side) are situated on the stage of an inverted microscope allowing simultaneous electro-
physiological and optical monitoring. (a) Open chamber with heated cap (to prevent condensation) and CO
2
line
for pH control. (b) Dual closed chamber served by two-channel peristaltic pump.