Environmental Engineering Reference
In-Depth Information
Upper
midwest
Industrial
midwest
Northwest
Northeast
Effect of PM
10
1
0.5
4
Southern
California
2
Southeast
Southwest
0
0.0
Mean
Ratio
(a)
0
2
4
−4 −2
−4 −2
0
2
4
(b)
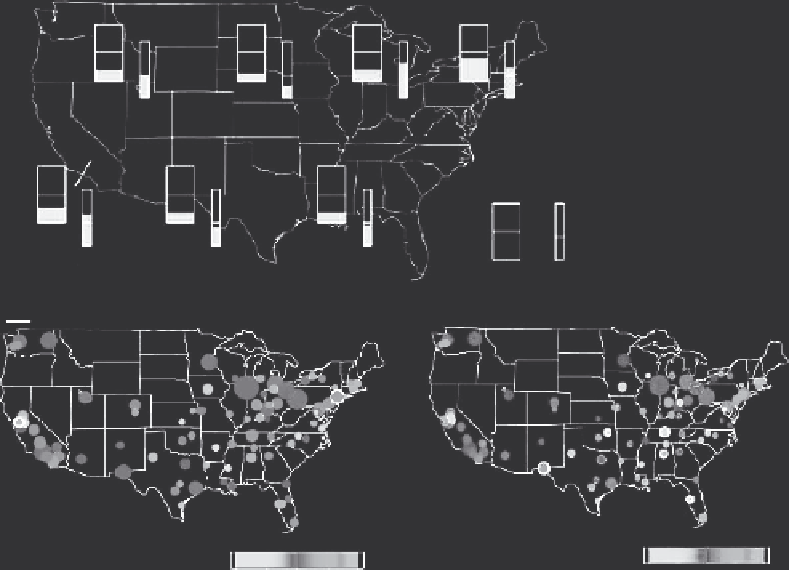
FIGURE 23.25
(a) Regional differences in estimated % change in daily total mortality per 10 μg/m
3
increase in PM
10
. The height of the shaded area in the box on the left is the region-speciic estimate. Shade
area in the box on the right is the t-ratio (posterior mean divided by posterior standard deviation). (From
Dominici, F. et al., Mortality among residents of 90 cities,
Special Report: Revised Analyses of Time-Series
Studies of Air Pollution and Health
, Health Effects Institute, Ed., Health Effects Institute, Boston, MA, pp.
9-24, 2003.) (b) Within city total (left panel) and cardiovascular (right panel) mortality from NMMAPS.
Color bars deine ranges of % changes, and the sizes of the circles are proportional to the precision of the
effect estimates. (From Dominici, F. et al.,
Environ. Health Perspect
., 111, 39, 2003.)
were observed by Dominici et al. [245] in a study of daily mortality in four U.S. cities between 1987
and 1994 (Figure 23.33). Results were similar for frequency domain and timescale estimates. In
response to a critique of their approach [246], these authors evaluated 12 mortality rates (four cit-
ies and three categories of mortality) at timescales less than and greater than 5 days (Figure 23.34)
[247]. In most cases, the estimates at greater than 5 days are greater than those at less than 5 days
(Figure 23.34). While most of the data cited indicate that effects of ambient PM on daily mortality
are largest for longer timescales, they do not negate the fact that shorter timescales are also associ-
ated with increased mortality. Nonetheless, the short-term associations do not appear to be the result
of mortality displacement.
Although this chapter does not cover the extensive body of data related to the associations
between PM and hospital admissions for respiratory and cardiovascular disease, these data have
been used to support the causal connection between changes in ambient PM and daily mortality.
Bates [143] argued that if the association was likely to be causal, then there should be increased
risks for hospitalization for cardiorespiratory diseases. Such data have been compiled and were used
to bolster the argument for the setting of the PM standard in 1996 (Figure 23.35).
Search WWH ::

Custom Search