Environmental Engineering Reference
In-Depth Information
1.00
1.00
0.92
1.00
0.88
0.96
CVDRESP
Total
Others
Lag 1
Lag 0
Lag 2
−0.2
0.0
0.2
0.4
0.6
0.8
1.0
−0.2
0.0
0.2
0.4
0.6
0.8
1.0
% Change in mortality per 10 µg/m
3
increase in PM
10
% Change in mortality per 10 µg/m
3
increase in PM
10
(a)
(b)
PM
10
PM
10
+O
3
1.00
1.00
0.96
0.97
0.98
PM
10
+O
3
+NO
2
PM
10
+O
3
+ SO
2
PM
10
+O
3
+CO
−0.25
0.0
0.25
0.5
0.75
(c)
% Change in mortality per 10 µg/m
3
increase in PM
10
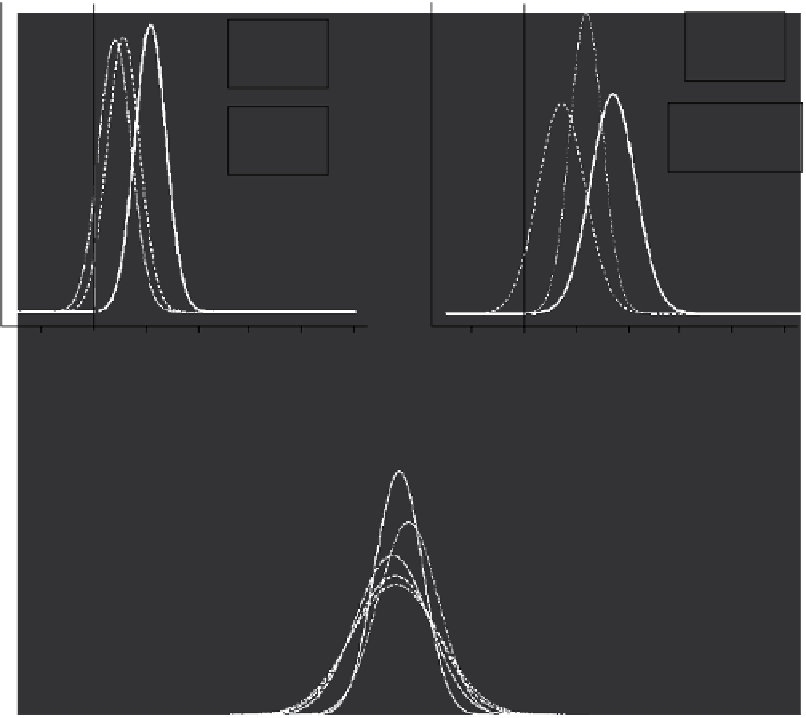
FIGURE 23.24
Results from the revised NMMAPS analyses [310]. (a) Marginal posterior distribution of the
national average effect of 10 μg/m
3
increase in PM
10
on total, nonaccidental mortality based on different lags.
(b) Comparative marginal posterior distribution of the national average effect of 10 μg/m
3
increase in PM
10
at lag 1 on total, cardiorespiratory (CVDRESP), and “other” mortality. (c) Marginal posterior distribution of
effect of 10 μg/m
3
increase in PM
10
at lag 1 in models with other pollutants. Box at upper right includes pos-
terior probabilities that PM
10
effects are greater than 0, based on pooled city-speciic estimates in a two-stage
hierarchical model.
a
Revised pooled estimates. (From Dominici, F. et al., Mortality among residents of 90
cities, Special Report: Revised Analyses of Time-Series Studies of Air Pollution and Health, Health Effects
Institute, Ed., Health Effects Institute, Boston, MA, pp. 9-24, 2003.)
evidence of harvesting at the 60-day averaging window, and pneumonia showed evidence of short-
term harvesting, followed by increased percentage increases (Figure 23.31). These data imply that
COPD deaths are being brought forward by about 2 months, while deaths from pneumonia and IHD
are not due to harvesting and may relect “enrichment” of the at-risk pool as a consequence of per-
sistent exposure to increased average levels of PM [242]. An analysis of the APHEA project, based
on distributed lag models applied to ten cities, failed to ind strong evidence for mortality displace-
ment for total daily mortality (Figure 23.32) [244]. Moreover, the effect estimate for mortality for
exposures 11-60 days before death was more than two-thirds as large as that for 10 days just prior
to death (0.688 ± 0.261 vs. 0.922 ± 0.184, respectively—both estimates are ×10
3
). Similar results


Search WWH ::

Custom Search