Environmental Engineering Reference
In-Depth Information
4.0
Low
CI medium, NS
CI high, NS
CI medium, p < 0.05
CI high, p < 0.05
AORs
3.5
3.0
2.5
2.0
1.5
1.0
0.5
0.0
1st
2nd
3rd
4th
5th
6th
7th
8th
9th
(a)
Months of gestation
First month
Last 6 week
First month
Last 6 week
2
CO
PM
10
1
0.5
(b)
3.0
Exposure to TSP
in third trimester
High exposure
Moderate exposure
Low exposure
2.5
2.0
1.5
1.0
0.5
0.0
−0.5
−1.0
−1.5
−2.0
2000 2250 2500 2750 3000 3250 3500 3750 4000 4250 4500 4750 5000
(c)
Birth weight (g)
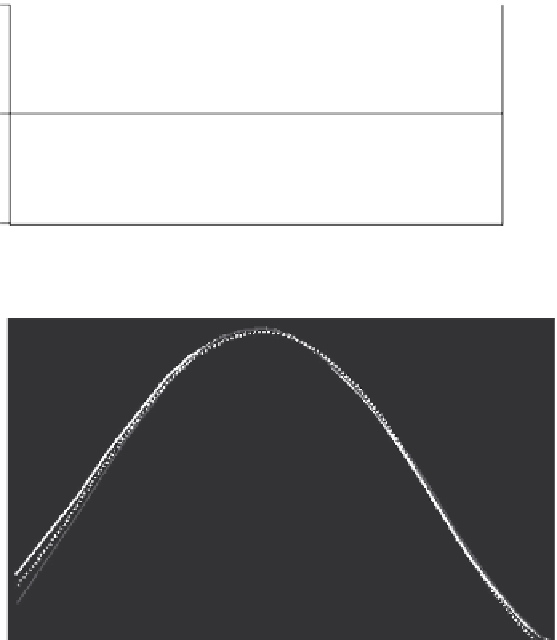
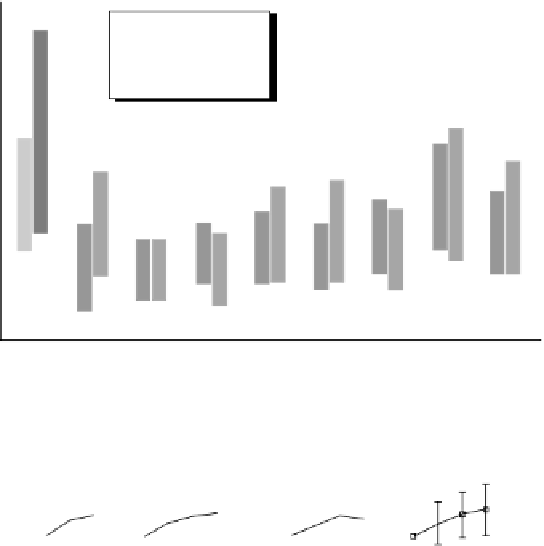
FIGURE 23.19
Timing of exposure to ambient PM aerosol and effects on birth outcomes. (a) Adjusted
odds ratios (AOR) for associations of trimester-speciic estimates of exposure to TSP on IUGR in the Czech
Republic. (From Dejmek, J. et al.,
Environ. Health Perspect
., 108, 1159, 2000.) (b) RRs for PTD based on
quintiles of exposure to CO and PM
10
during the irst month and last 6 weeks of pregnancy by quintile of
exposure in southern California, United States. (From Ritz, B. et al.,
Epidemiology
, 11, 502, 2000.) (c) Effect
of exposure to TSP in the third trimester on the distribution of BW in Beijing, China. (From Wang, X. et al.,
Environ. Health Perspect
., 105, 514, 1997.)


Search WWH ::

Custom Search