Biomedical Engineering Reference
In-Depth Information
The use of intermittent pumping for chemical delivery, as developed for the
demonstration-scale study, enabled testing of a “trap-and-treat” strategy for sorption/biodeg-
radation (Dybas et al.,
2002
). The basic concept is that contaminant degradation, stimulated in
this case by weekly feeding of
P. stutzeri
KC, enabled removal of solution phase CT, leading to
its desorption from the solid phase and cleansing of the solids. Then, in the week-long intervals
between feeding events, new CT-contaminated groundwater is allowed to enter the treatment
zone, recontaminating the solid phase. CT presumably moves into the treatment zone at a rate
equal to the average linear velocity of the groundwater (15 cm/d at Schoolcraft) divided by the
contaminant retardation factor (2.7 based on the data for CT shown in Table
9.3
), or 5.6 cm/d.
Therefore, in a 1-week period between pumping episodes, the CT did not break through the
treatment zone, having traveled only 15/2.7
39 cm into the treatment zone through which
groundwater was intermittently re-circulated. This continuous cycling between transformation/
desorption and sorption resulted in a “trap-and-treat” sequence.
This type of cycling between periods of intermittent degradation and transport by natural
gradient flow may provide an efficient option for semi-passive removal of contaminants. In
this mode of operation, the time required for pumping was only that required to reactivate
transformation, and the interval between pumping becomes a function of the sorption capacity
of the solids. For details of the modeling used for design and simulation of the strain KC
biocurtain, see Hyndman et al. (
2000
) and Phanikumar et al. (
2002a
,
b
,
2005
).
In addition to CT degradation, two additional contaminants, CF and nitrate were followed
over the course of the demonstration-scale experiment. CF appeared transiently when acetate
was added in excess or the amount needed for nitrate removal, thereby stimulating sulfate
reduction (Figure
9.16
), a condition known to result in CF formation. When the added acetate
concentrations were decreased to levels that allowed for some surplus nitrate, CF production
ceased, and nitrate levels still remained below the regulatory limit of (37 mg/L or ppm)
(Figure
9.17
).
7
¼
Inoculation
Days 122-125
179-181
314
392
641
12.0
24.0
1
5
Distance from
delivery wells (m)
CF [ppb]
0 5 10 15 20
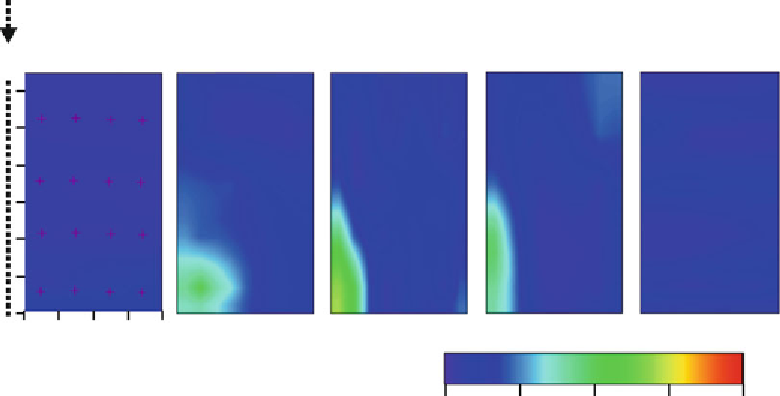
Figure 9.16. Krieged images showing changes over time in chloroform concentrations in the
monitoring wells downgradient from the delivery well gallery. Results are shown for Transect A
in Figure
9.13
. CF was detected during a period of sulfate-reduction. Decreasing acetate feed
concentration prevented CF formation, and led to an excess of nitrate (Figure
9.17
). Reprinted with
permission from Dybas et al.,
2002
. Copyright 2002, American Chemical Society.
Search WWH ::

Custom Search