Biomedical Engineering Reference
In-Depth Information
Table 9.5. P. stutzeri KC Concentrations in the Sediment (Days 336-342). See Figure
9.13
for
delivery well locations.
Sediment
Boring
Location
Center of Grid, 1.5 m
Downgradient from
Well D8
Center of Grid, 3.0 m
Downgradient from
Well D8
Northeast Section,
1.5 m Downgradient
from Well D11
Southwest Section,
1.5 m Downgradient
from Well D3
Depth (m)
P. KC
(cfu/g)
Native
flora
(cfu/g)
P. KC
(cfu/g)
Native
flora
(cfu/g)
P. KC
(cfu/g)
Native
flora
(cfu/g)
P. KC
(cfu/g)
Native
flora
(cfu/g)
2.1 10
5
5.8 10
5
9.2 10
4
1.2 10
6
8.1 10
4
4.9 10
5
8.8 10
4
4.1 10
5
10.7
9.5 10
4
2.5 10
5
6.5 10
5
8.8 10
4
2.7 10
5
7.6 10
4
4.1 10
5
13.8
Nd
3.0 10
4
2.1 10
5
4.1 10
4
3.3 10
5
1.3 10
5
2.9 10
5
4.3 10
4
1.6 10
5
16.8
10
5
10
5
10
5
10
5
10
4
10
5
10
5
10
5
19.8
1.6
3.8
1.6
3.7
6.0
2.3
1.1
2.2
1.7 10
5
5.2 10
5
1.8 10
4
1.4 10
5
5.9 10
4
2.7 10
5
1.3 10
5
1.8 10
5
22.9
10
5
10
4
10
4
10
4
10
4
10
4
10
4
25.9
1.3
4.1
Nd
7.1
1.5
4.4
2.2
5.4
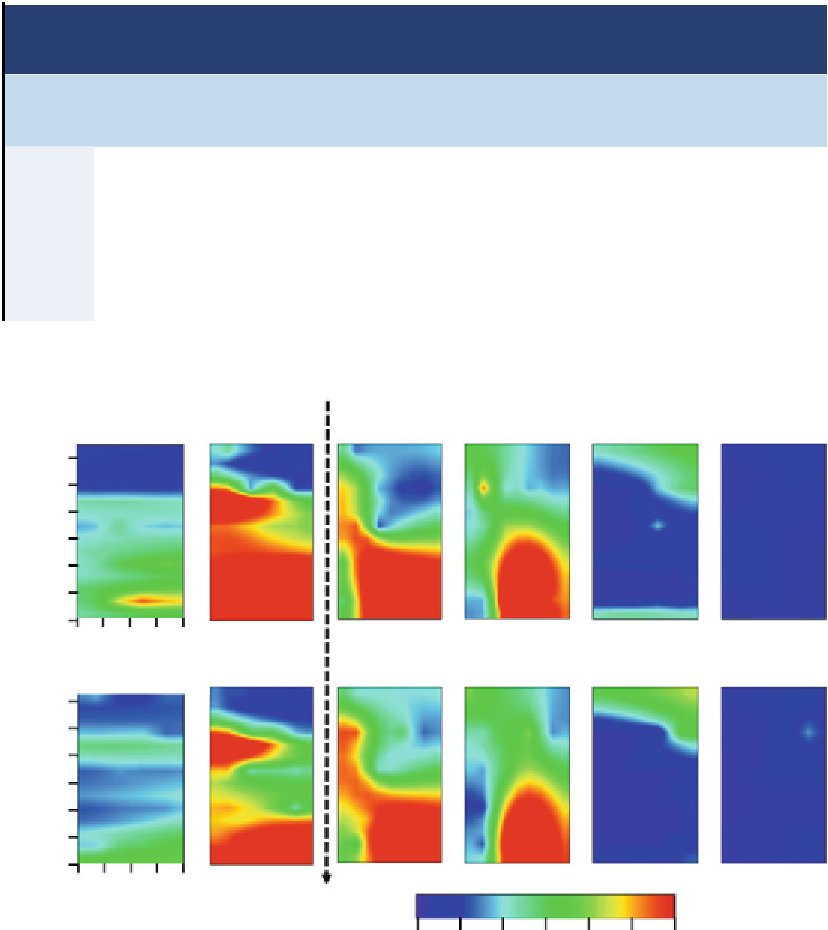
Inoculation
Transect A
Days 25
97-99
122-125
179-181
314
392
12.0
14.0
16.0
18.0
20.0
22.0
24.0
1
5
Distance from
delivery wells (m)
Transect B
12.0
14.0
16.0
18.0
20.0
22.0
24.0
1
5
Distance from
delivery wells (m)
CT [ppb]
0 5 10 15 20 25 30
Figure 9.15. Krieged images showing changes over time in CT concentration in the monitoring
wells downgradient from the delivery well gallery. Transects A and B are shown in Figure
9.13
. The
biocurtain was first detected at lower depths were flow was fastest, and in wells closest to the
delivery well gallery. Reprinted with permission from Dybas et al.,
2002
. Copyright 2002, American
Chemical Society.
also were switched weekly. A significant benefit of the intermittent pumping strategy employed
is the low pumping volumes and short duration of pumping. The modeling used to establish
time periods and pumping rates for these operational decisions is summarized in Hyndman
et al. (
2000
).


Search WWH ::

Custom Search