Information Technology Reference
In-Depth Information
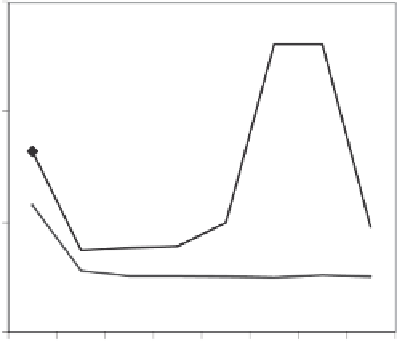
75,000
50,000
LuxTet4B9
RCV Only
25,000
0
aTc (ng / ml)
Figure 7.22
Controlling the sender's signal strength: maximum response of receivers
to different anhydrotetracycline (aTc) induction of senders.
resuspended in fresh 400
l
droplets of receiver cells on an LB Amp/Kan and 1 mM IPTG agar plate and
dried them for 10 min. Then, 0.2-
µ
l LB Amp/Kan and 1 mM IPTG. We spotted 10
µ
l droplets of sender cells were spotted next
to the receivers such that the senders partially overlapped the receiver cells. A
quick check under the microscope showed that the sender cells were emitting
cyan fluorescence, while the receivers exhibited no fluorescence. The plate was
then incubated for1hat37°C.
Figure 7.23 shows the fluorescence pattern of a sender droplet partially over-
lapping a receiver droplet after the incubation period. The images were captured
with a Plan Fluor 4
µ
objective, using the cyan and yellow filters (the yellow
filter is better than the green filter for distinguishing between cyan fluorescence
and green fluorescence). The physical width of each image is approximately
1
.
7 mm. The senders were still emitting cyan fluorescence, while the receiver
cells were emitting green fluorescence due to the VAI that diffused from the
senders. The interesting patterns resulted from liquid diffusion and mixing.
Figure 7.24 shows fluorescence images of the same communication exper-
iment under a higher magnification (40
×
objective). Each picture represents
a montage of three overlapping image captures, with a total physical width
of approximately 0
.
27 mm. At this degree of magnification, some individual
bacterial cells can be distinguished.
×