Geology Reference
In-Depth Information
450
350
250
150
50
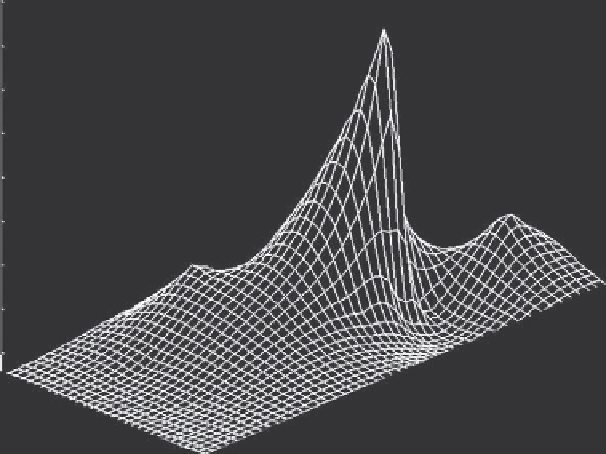
Figure 16.4.11. Temperature surface generated from temperature data obtained at 43 thermocouple temperature
wells at a spacing of 5m. Temperatures were taken at 0.3-m-depth increments. Surface represents highest
temperature at any one location. From Chaiken et al. 1996.
localized nature of subsurface combustion (Figure 16.4.11.). It shows a primary combustion zone adjacent to the
southern slope and additional heated areas to the northwest and to the east of the primary zone. Temperatures were
obtained by inserting a TC probe into the TC well to the appropriate depth, allowing the probe to reach equilibrium,
recording the temperature, and then lowering the probe to the next predetermined point. Even for a relatively small
site, with computer processing of the data, this was a labor intensive process. However, it had the advantage of
providing a three-dimensional view of the heated areas and also showed visual evidence of the effect of the
cryogenic injection (Figure 16.4.12.).
450
350
250
150
50
Figure 16.4.12. Temperature surface generated from temperature data obtained at Midvale waste bank after
injection of cryogenic slurry. From Chaiken et al. 1996.