Geology Reference
In-Depth Information
Diagnostic bands * (nanometers)
1600
1676
1950 (coincident w/water)
2344
8
6
4
Reagent NH
4
Cl
*
2
*
*
Salammoniac
Vent 5 Wuda, China
*
0.0
1400
1600
1800 2000
Wavelength (nm)
2200
2400
Figure 10.1.7. SWIR spectrum of salammoniac collected from vent 5 in the Wuda coalfield, Inner Mongolia
autonomous region of northern China (Stracher et al., 2005). The valleys in the spectra represent wavelengths of
infrared absorbed by the molecular vibration of ammonia and water in the sample. Plotted above with a vertical
offset is the spectrum for reagent grade NH
4
Cl. Both spectra are very similar to the ammonium chloride GDS77
spectrum in the US Geological Survey Spectral Library (http://speclab.cr.usgs.gov). The asterisk, *, marks the
location of prominent bands that serve as diagnostic spectral features for the identification of salammoniac. The
vertical scale represents
in spectroscopy. Reflectance is a
measure of the ratio of the total amount of light reflected by a surface to the total amount of light incident to the
surface. The SWIR spectrometer uses its own radiation source and hence the reflectance is relative to radiation
reflected from a standardized surface. Reflectance is a complex phenomenon that is a function of radiation
wavelength, refractive indices of the media through which the light travels, and the angle of incidence of the
light. Photo by Paul A. Schroeder, 2008
pseudoreflectance
, which is similar to
reflectance
“
”
“
”
.
In addition to confirming the identification of a phase, SWIR may provide field data that can potentially be
correlated with satellite spectral, reflectance studies. This is possible because some satellites are equipped with
spectrometers that measure the reflectance of the earth
s surface. Such reflectance studies are effective reconnais-
sance tools for identifying hydrothermal alteration areas of regional extent. These areas are economic targets for
mineral exploration. Some commonly used spectral bands are shown in Figure 10.1.8.
'
A
5000
Yellow crust
B
White flake
A
4000
3000
3000
B
Spot A
2000
Spot B
2000
1000
Alunogen
1000
Muscovite/basaluminite
0
1400
1800
2200
1400
1800
2200
Wavelength (nm)
Wavelength (nm)
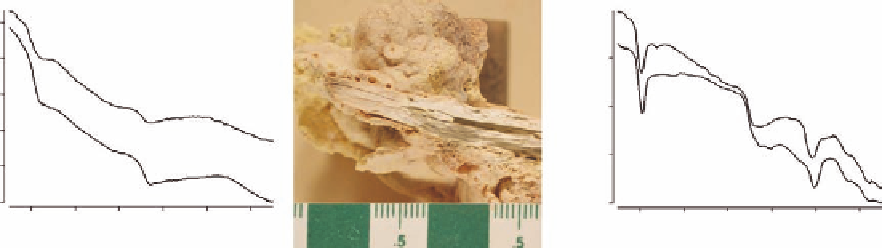
Figure 10.1.8. SWIR spectra of gas-vent minerals from the Centralia mine fire, Pennsylvania (Stracher et al.,
2006). The center image is a reflected light photograph (scale bar in centimeters) showing frothy yellow vent
mineralization at A and a white flake at B of a rock fragment altered by high temperature. The SWIR spectrum in
the upper part of the left photo is from location A and the spectrum beneath this for alunogen, from the US
Geological Survey Spectral Library (http://speclab.cr.usgs.gov). The SWIR spectrum in the upper part of the right
photo is from location B and the spectrum beneath this is for a 50:50 mixture of muscovite and basaluminite, from
the US Geological Survey Spectroscopy Lab (http://speclab.cr.usgs.gov). See Figure 10.1.7 concerning
pseudoreflectance. Photo by Paul A. Schroeder, 2007
.