Geology Reference
In-Depth Information
Cl
S
30
μ
m
30
μ
m
30
μ
m
Figure 10.1.5. Secondary backscattered electron image (center) of minerals nucleated at a coal-fire gas vent,
Mulga gob fire, Alabama. WDS maps the location of specific elements. The WDS map on the left shows the
location of chlorine, found in salammoniac. This map corresponds with the slightly darker gray, euhedral crystals in
the center photo. The WDS map on the right shows the location of native sulfur and corresponds to the very tiny,
brighter gray crystals in the center photo. Photo by Paul A. Schroeder, 2007
.
Short-Wave Infrared Spectroscopy
A
popular approach used to assist in the exploration of economic ore deposits is SWIR (Herrmann et al., 2001; Sun
et al., 2001). SWIR is useful in the field, where data can be collected with a portable unit that measures reflectance
in the spectral range of 1300
2500 nm (Figure 10.1.6). Newer spectrometers accommodate higher frequencies,
which occur in the very near infrared range (VNIR), i.e., down to 500 nm (recalling that wavelength and frequency
of electromagnetic radiation are related by the speed of light).
-
Absorption in the SWIR range is attributed to
(analogous to musical overtones and combinations of
tones) that result from fundamental molecular vibrations in chemical groups such as CO
3
2
-
,NH
4
+
,SO
4
2
-
,Al
“
harmonics
”
-
O
-
H,
H, H
2
O, and OH
-
(Figure 10.1.7). Crystal vibration theory is extremely complex; therefore,
spectra that can be interpreted for phase identification on the first principle theories of vibration spectroscopy are
rare (Schroeder, 2002). The interpretation of SWIR spectra and their relationship to mineral composition and
structure are accomplished by comparing specific groups of mineral spectra and correlating those spectra with other
data about crystal chemistry acquired by XRD, EMPA, etc.
Fe
-
O
-
H, Mg
-
O
-
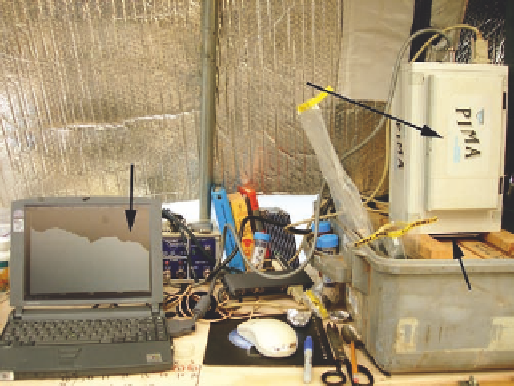
SWIR field unit
Spectrometer
Computer date
collection
Sample
Figure 10.1.6. Portable field-based short-wave infrared spectrometer. The lower end of the spectrometer contains
a port that emits an infrared (IR) light source through a window port. The computer controls the experiment by
measuring the ratio of an instrument signal blank to the instrument signal with the sample in the window.
Wavelengths absorbed by the minerals appear as
or absorption bands in the IR spectrum. In this
example, the bands are seen on the computer screen. The spectrometer is pictured here in a field tent, but it can
also be brought directly to an outcrop in the field. Water inside of or on the sample can contribute significantly to
the signal and must be carefully interpreted by the analyst. Photo by Paul A. Schroeder, 2006
“
valleys
”
.