Geology Reference
In-Depth Information
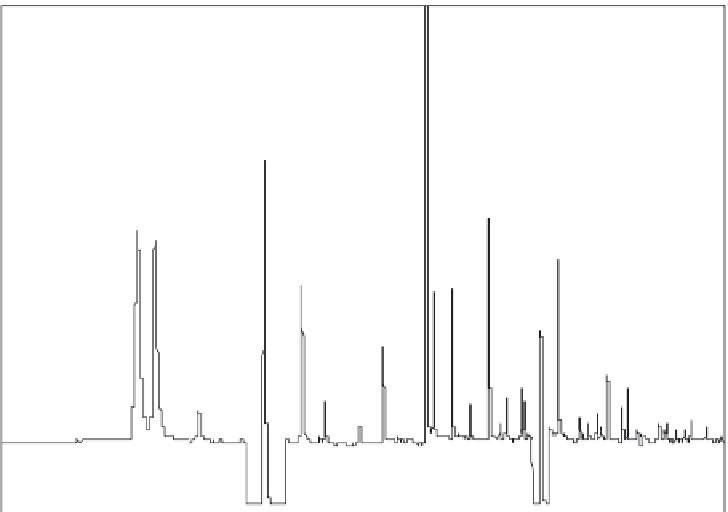
mV
50.0
40.0
30.0
20.0
10.0
min
0
0
1.0
2.0
3.0
4.0
5.0
6.0
7.0
8.0
9.0
10.0
11.0
12.3
Time (minute)
Figure 8.1.6. Chromatogram from an electron capture detector.
______________________________
DB-5
→
RESTEK is a 50m
0.25mm id DB-5 column connected to a
5m
0.25mm id RESTEK 1701 column
DB-5MS is a 50m
0.25mm id DB-5MS column
RESTEK is a 50m
0.25mm id RESTEK column
PLOT
→
DB-1 is a 30m
0.52mm id PLOT column connected to a 3m
0.25 id DB-1 column
DB-1 is a 50m
0.25mm id DB-1 column
Quality Control: Standards
A
s conditions in and around the system change, precision analysis suffers. Because of this the Blake/Rowland
group has adopted several methods of monitoring these changes as they happen. One method of quality control
used by the group is running standardized samples through the system after every four field samples. The group
makes its own working standards at White Mountain Research station located in the Sierra Nevada Mountains in
California (altitude 10,500 ft). This air is too clean for some cases so selected gases are added to the cylinder in the
lab so that concentrations in the cylinder are representative of gas concentrations that are measured. Precalibrated
standards are also used for calibrating the systems and are purchased from analytical suppliers. The standards used
with the field samples are as representative as possible of what compounds are expected to be measured in the
samples. The standardized samples (Figure 8.1.7) contain known amounts of compounds and the systems
quantitative analysis can be weighed against these known values to illuminate changes in system sensitivity.
Thus, compound retention times (time of elution) in the resulting chromatogram can be compared to previous
standards to determine a shift in retention time of the system.