Geology Reference
In-Depth Information
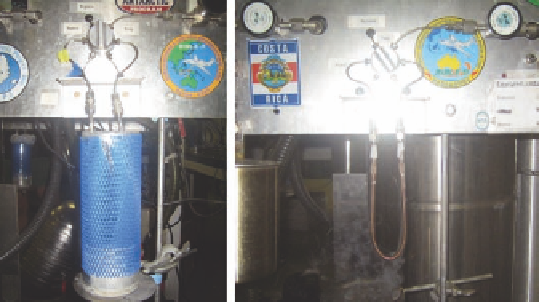
Sample loop submerged
in liquid N
2
Exposed sample loop
Figure 8.1.4. Sample loop for VOC system.
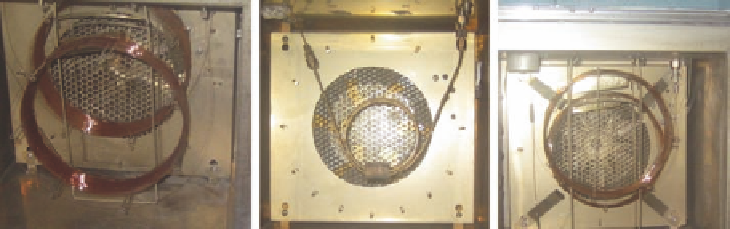
Two capillary columns in
series: two detectors
Packed column:
1 detector
Capillary columns in series:
1 detector
Figure 8.1.5. Columns in various GC ovens.
Once the sample is prepared, it is transported by a helium carrier gas through a junction which reproducibly divides
the sample into five streams. Each of these streams is sent through one of the system
s five columns. The ratio of
sample sent through each column is set to maximize detection of compounds for each of the five detectors.
'
After being separated within the column, the groups of compounds from the sample are measured by the detector at
the end of the respective columns. This response of the detector is then integrated by Chromeleon chromatography
software as a chromatogram. In the form of a chromatogram, the compound groups appear as a peak when plotted
against time. A typical chromatogram is shown in Figure 8.1.6.
The sample percentage sent to each of the 5 columns is:
GC-1:
Durabond-5 (DB-5)RESTEKECD 6.8%
Durabond-5MS (DB-5MS)MSD 10.1%
GC-2:
RESTEKECD 7.2%
Porous layer open tubularDurabond-1 (DB-1)FID 60.8%
GC-3:
DB-1FID
15.1%