Information Technology Reference
In-Depth Information
Tip 135
Watch CPU Load and Activity
To have a small floating window appear showing CPU activity at the present
time, start Activity Monitor (Open Finder, select the Applications list, and
then double-click Activity Monitor within the
UTILITIES
folder), and click the
Window menu. Then select Floating CPU Window, and choose from either
horizontal or vertical displays. The floating window will appear at the bottom
left of the screen, and you can click and drag to move it around.
On most modern Macs, you'll see two, four, or more charts, representing each
of the cores in the processor. If you're using a high-end Mac Pro system, you
might have up to sixteen processing cores and therefore sixteen bar charts!
To get rid of the graph, select None from the Floating CPU Window menu.
To see a graph showing the CPU load over time, select the CPU History entry
from the Window menu. To get rid of it, just click the Close button on the
window.
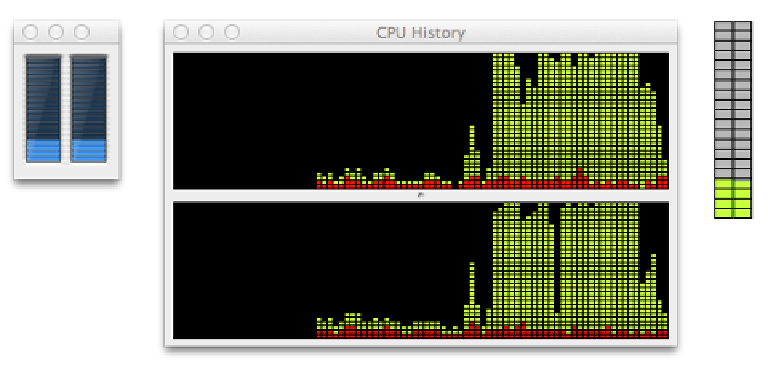
For examples of the various CPU load graph types, see
Figure 23,
Graphing
Figure 23—Graphing CPU load