Graphics Programs Reference
In-Depth Information
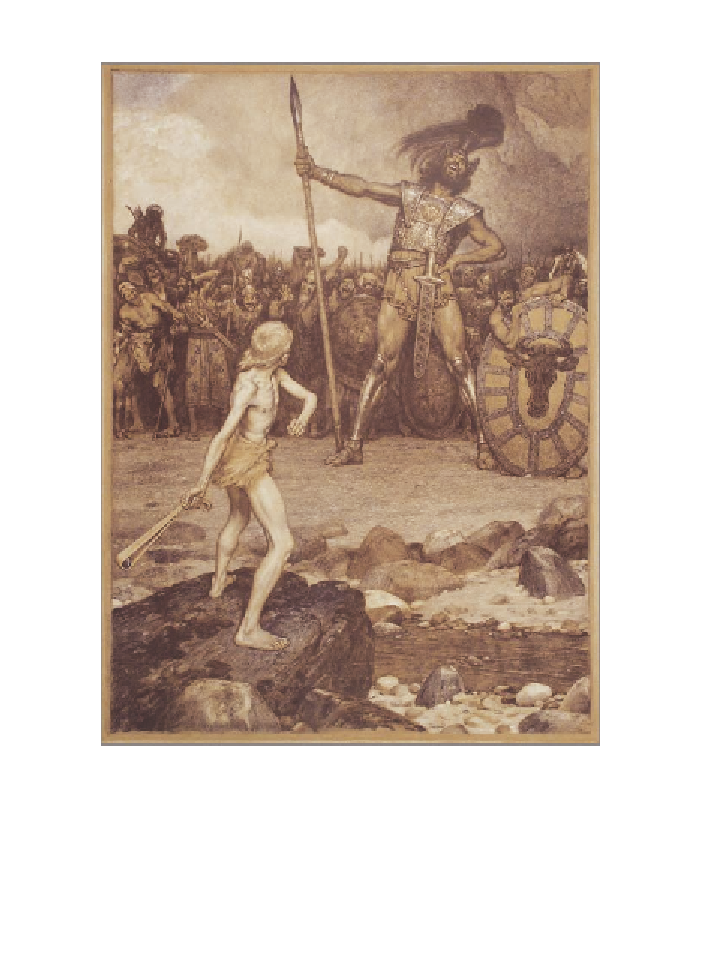
FIGURe 11.1
Original color lithograph
David and Goliath
by
Osmar Schindler (1888)
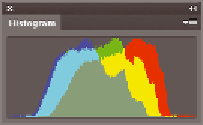
Shadows
Highlights
FIGURe 11.2
The image's
histogram shows how it fills the
available tonal range
4.
Choose Image a Adjustments a Levels (or press Cmd+L). The
histogram takes the center stage of the Levels dialog box. Drag the