Information Technology Reference
In-Depth Information
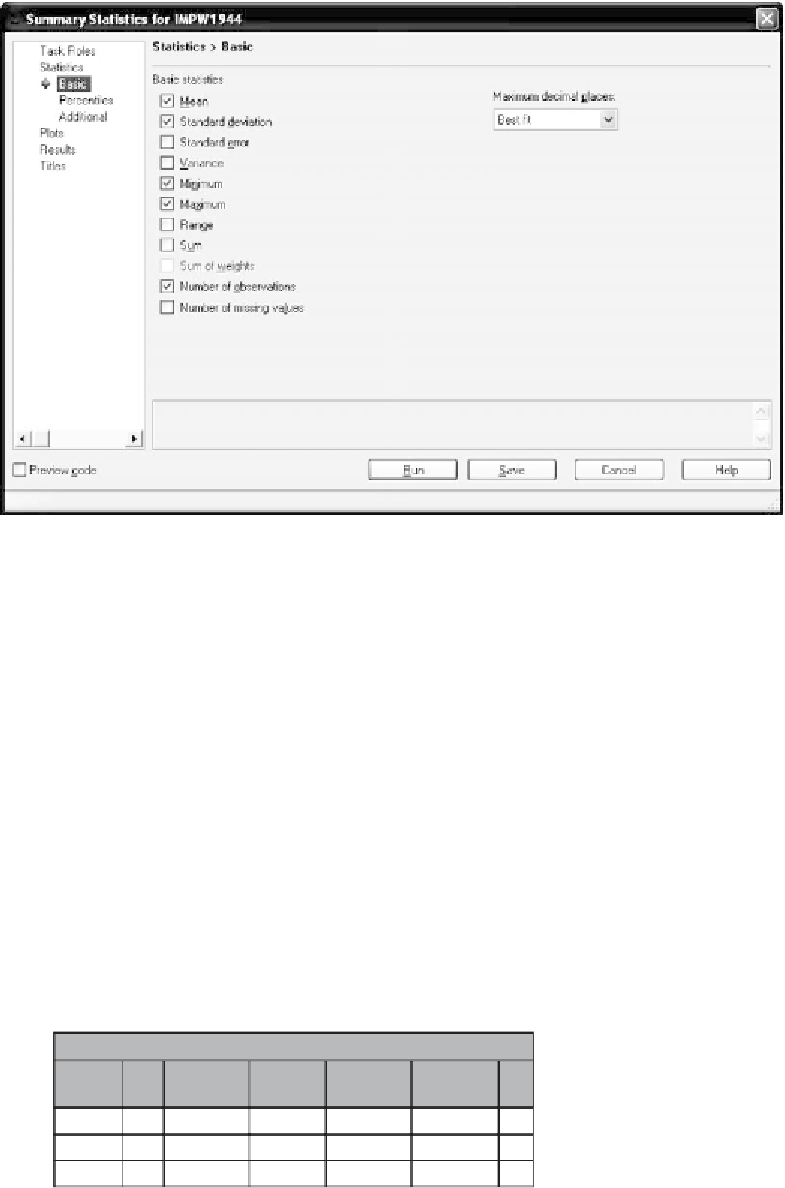
Figure 5.29
The
Basic Statistics
tab.
therapy
under
Classification variables
in the
Summary Statistics Roles
panel. By using
therapy
as a classification variable, we will obtain descrip-
tive statistics (on the dependent variable GAF score) for each of the therapy
groups separately.
Select the
Basic Statistics
tab. We have opted to display the mean,
standard deviation, minimum and maximum scores, and the number of
observations as shown in Figure 5.29. Click
Run
to perform the analysis.
The descriptive statistics for each therapy group are displayed in Fig-
ure 5.30. The therapy group coded as 1 (brief psychotherapy), for exam-
ple, had a mean GAF score of 61.00 with a standard deviation of 9.06
(rounded); the lowest score in the group was 50 and the highest was 72.
Summary Statistics
Results
The MEANS Procedure
Analysis Variable : GAFscore GAFscore
N
Obs
therapy
Mean
Std Dev
Minimum Maximum
N
1
2
3
5
5
5
61.0000000
44.8000000
70.4000000
9.0553851
8.0746517
1.1401754
50.0000000
35.0000000
69.0000000
72.0000000
55.0000000
72.0000000
5
5
5
Figure 5.30
Output from the
Basic Statistics
procedure.