Information Technology Reference
In-Depth Information
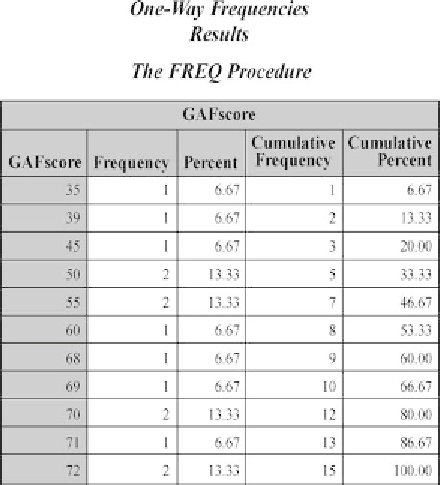
Figure 5.27
Frequencies output.
output files, each providing the same information. The output is shown
in Figure 5.27 and is structured in the same way as described for SPSS.
We will now obtain the descriptive statistics. From the main menu
select
Describe
➜
Summary Statistics
to arrive at the screen shown in
Figure 5.28. We have placed
GAFscore
under
Analysis variables
and
Figure 5.28
The
Task Roles
screen with
GAFscore
as the
Analysis
variable.