Information Technology Reference
In-Depth Information
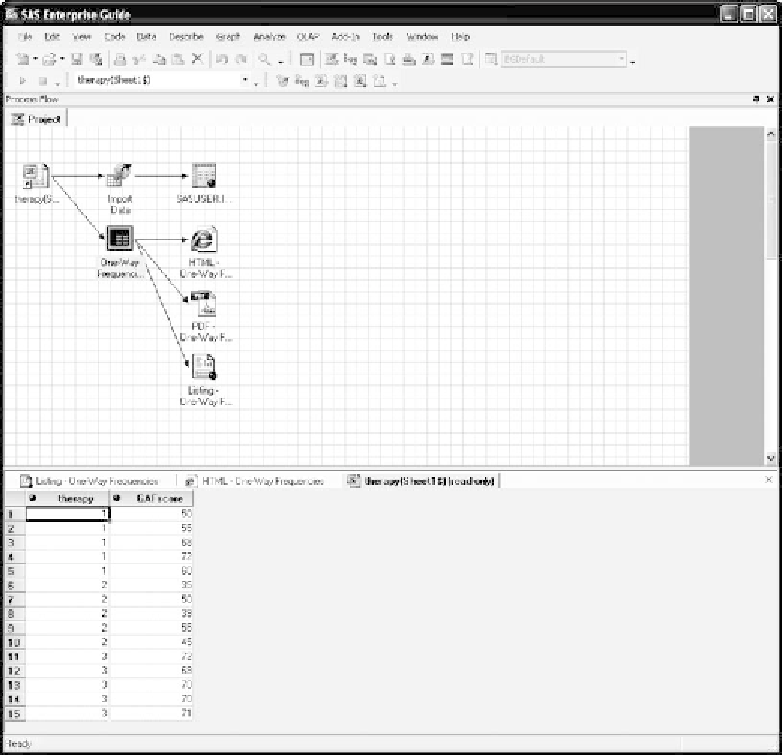
Figure 5.26
The
Project
window with the analysis setup and the output files displayed.
variables
from the short menu. When done, your screen will resemble the
one shown in Figure 5.24.
Selecting the
Statistics
tab in the navigation panel of the
One-Way
Frequencies
procedure brings you to the screen shown in Figure 5.25.
Select
Frequencies and percentages with cumulatives
and check the box
for
Show frequencies
under
Missing values
(we do not have missing
values in this small data file, but in larger data files this is not uncommon
and this information will be tabulated in the
Frequencies
output). Click
Run
to perform the analysis.
The
One-Way Frequencies
analysis structure and icons for the output
files are now shown in the
Project
window (see Figure 5.26). We had set
up the
Options
under the general
Tools
menu to display the results in
HTML
,
PDF
,and
Te x t
format (you may wish to indicate fewer displays,
but we suggest that one of them should be
PDF
); thus, we have three