Information Technology Reference
In-Depth Information
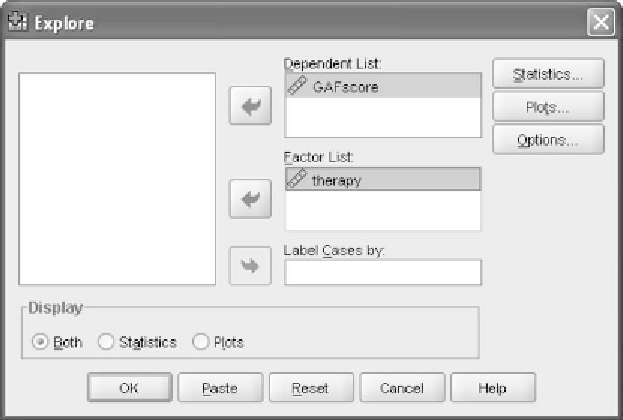
Figure 5.11
Main
Explore
window.
The left panel of the dialog window contains a list of all the variables in
the analysis. We click over the continuous dependent variable (GAFscore)
to the
Dependent List
window. The
Factor List
window allows you to
click over categorical independent variables that will “break” or partition
univariate outliers by each group or level of the independent variable. We
click over our remaining categorical independent variable (
therapy
)tothe
Factor List
window to obtain these profiles. Below the panel of variables
(on the left side) is the
Display
panel, which allows you to toggle between
arequestfor
Statistics
(basic descriptive statistics) or
Plots
(window plots
or stem-and-leaf plots) for describing each variable. The SPSS default is to
displayboth.Ontherightsideofthedialogwindowarethreepushbuttons:
Statistics
,
Plots
, and
Options
. These three pushbuttons allow you to
request additional descriptive statistics, plots, and ways of overriding the
default (listwise) missing values option.
Click the
Statistics
pushbutton and the
Explore: Statistics
dialog win-
dow is produced (see Figure 5.12). This dialog window is composed of four
check windows, two of which concern us here,
Descriptives
(the default)
displays basic descriptive statistics, and
Outliers
displays cases with the
five largest and smallest
ExtremeValues
for each dependent variable. Each
of these checkboxes has been clicked. Clicking
Continue
brings you back
to the main dialog window.
A click of the
Plots
pushbutton produces the
Explore: Plots
dialog
window (see Figure 5.13). The
Boxplots
panel produces boxplots for
each group or level of the independent variable. Such plots allow the
investigator to see the spread or variability of the scores within each
level of the independent variable. The
Plots
panel produces stem-and-leaf
and histogram plots of continuous dependent variables partitioned by