Information Technology Reference
In-Depth Information
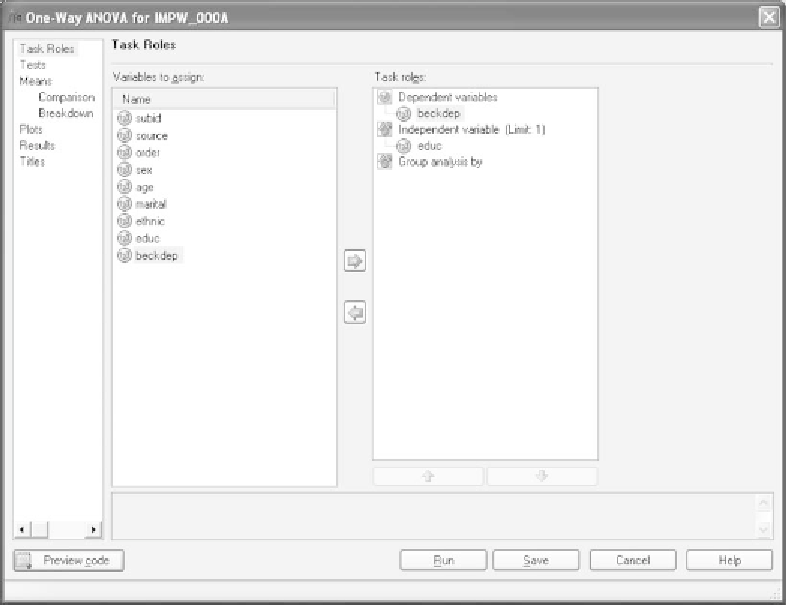
Figure B16
The
Task Roles
panel now shows the variables having been specified.
with the window shown in Figure B17. Next to each of the comparison
methods are checkboxes. In Figure B17 we have checked the
Bonferroni
comparison and, by doing so, have made available the drop-down menu
for
Confidence level
,forwhichwehaveselected95percent.
B.10
SAS ENTERPRISE GUIDE
OUTPUT
When you instruct SAS to perform a statistical analysis, it displays the
results in a window in the form that you have specified on the
Tools
menu.
We have provided you with an example of some output in PDF form.
Figure B18 contains summary table information from the ANOVA proce-
dure we performed. Included in this output is the
F
ratio, its probability of
occurrence if the null hypothesis is true, and the R squared (eta squared)
index of strength of effect provided by SAS in three separate displays.
Figure B19 presents some descriptive statistics for the groups in the
analysis. Recall that the dependent variable in the analysis was
beckdep
and SAS makes this very clear by labeling the columns
Mean of beckdep
,
Std. Dev. of beckdep
,
andStd.Errorofbeckdep
. Recall also that the
independent variable was
educ
,andSASdisplaysthisinformationinthe
very first column of the output.