Information Technology Reference
In-Depth Information
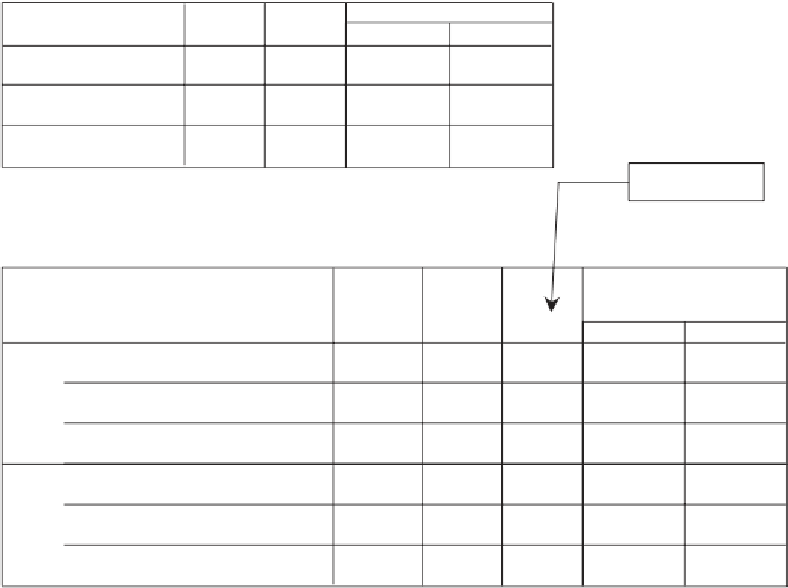
A. Estimates
Measure: MEASURE_1
95% Confidence Interval
leadership style
authoritarian
project
Mean
Std. Error
Lower Bound
Upper Bound
1
2
1
2
1
2
6.000
.416
5.093
6.907
1.000
.356
.225
1.775
democratic
6.400
.416
5.493
7.307
6.800
.356
6.025
7.575
lassez faire
3.600
.416
2.693
4.507
2.800
.356
2.025
3.575
Pairwise comparisons with
project as the first order.
B. Pairwise Comparisons
Measure: MEASURE_1
95% Confidence Interval
Mean
Difference
(I-J)
Difference
a
Sig.
a
project
1
(I)leadership style
authoritarian
(J)leadership style
democratic
lassez faire
authoritarian
lassez faire
authoritarian
democratic
democratic
lassez faire
authoritarian
lassez faire
authoritarian
democratic
Std. Error
Lower Bound
Upper Bound
-.400
.589
1.000
-2.037
1.237
2.400
*
.589
.005
.763
4.037
democratic
.400
.589
1.000
-1.237
2.037
2.800*
.589
.001
1.163
4.437
lassez faire
-2.400*
.589
.005
-4.037
-.763
-2.800*
.589
.001
-4.437
-1.163
2
authoritarian
-5.800*
.503
.000
-7.199
-4.401
-1.800*
.503
.011
-3.199
-.401
democratic
5.800*
.503
.000
4.401
7.199
4.000*
.503
.000
2.601
5.399
lassez faire
1.800*
.503
.011
.401
3.199
-4.000*
.503
.000
-5.399
-2.601
Based on estimated marginal means
*. The mean difference is significant at the .05 level.
a. Adjustment for multiple comparisons: Bonferroni.
Figure 13.19
The multiple comparisons for leadership style.
style. Interfacing with our graph, we can say that both laissez faire and
authoritarian styles result in poorer performance when teams are engaged
in complex projects compared to simple ones. We can also say that it
makes no difference what kind of projects are tackled by teams with a
democratic leadership style.
Figure 13.19 presents the results of the second set of simple effects
comparing levels of
leadstyl
. We are thus comparing the three styles of
leadership for
simple
projects and we are comparing the three styles
of leadership for
complex
projects; with respect to Figure 13.3, we are
determining if the three data points at
simple
differ significantly and we
aredeterminingifthethreedatapointsat
complex
differ significantly.
Our results indicate that under
project
level 1 (
simple
projects),
authoritarian and democratic styles are equally high but both result in
better performance ratings than the laissez faire group. Under
project
2
(complex projects), all groups differ significantly from all others.
Although we performed the Tukey post hoc test on
leadstyl
(shown
in Figure 13.20), it should now be clear that the interaction effects are