Information Technology Reference
In-Depth Information
A. Estimates
Measure: MEASURE_1
95% Confidence Interval
leadership style
authoritarian
project
1
2
1
2
1
2
Mean
Std. Error
Lower Bound
Upper Bound
6.000
.416
5.093
6.907
1.000
.356
.225
1.775
democratic
6.400
.416
5.493
7.307
6.800
.356
6.025
7.575
lassez faire
3.600
.416
2.693
4.507
2.800
.356
2.025
3.575
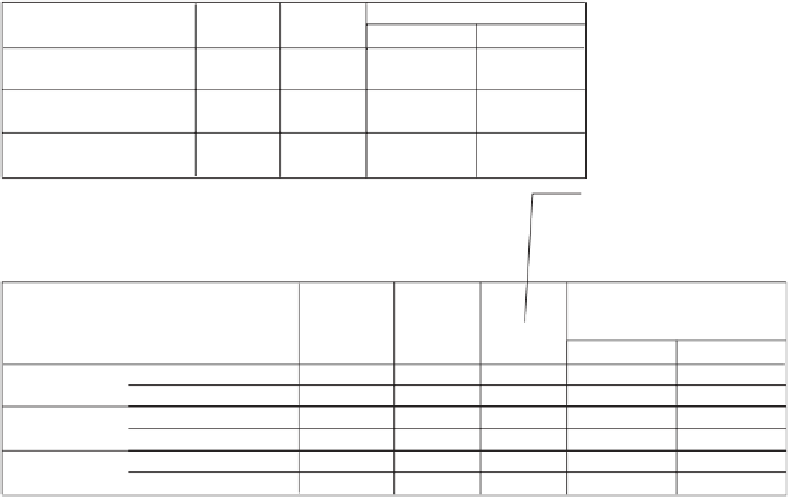
This Table presents significant
differences between the two
project levels for each level of
leadership style.
B. Pairwise Comparisons
Measure: MEASURE_1
95% Confidence Interval
Difference
a
Mean
Difference
(I-J)
Sig
a
leadership style
authoritarian
(I)project
1
2
1
2
1
2
(J)project
2
1
2
1
2
1
Std. Error
Lower Bound
Upper Bound
5.000
*
.316
.000
4.311
5.689
-5.000
*
.316
.000
-5.689
-4.311
democratic
-.400
.316
.230
-1.089
.289
.400
.316
.230
-.289
1.089
lassez faire
.800
*
.316
.026
.111
1.489
-.800
*
.316
.026
-1.489
-.111
Based on estimated marginal means
*. The mean difference is significant at the .05 level.
a. Adjustment for multiple comparisons: Bonferroni.
Figure 13.18
The multiple comparisons for project type.
13.7.2 SIMPLE EFFECTS TESTS
We have added our simple effects syntax as shown in Figure 13.17
by duplicating the
/EMMEANS
TABLES
subcommand containing the
two-way interaction and adding our
compare
syntax to each. Select
Run
=
All
from the main menu.
➜
13.8 OUTPUT FOR THE POST-ANOVA ANALYSIS IN SPSS
The simple effects output is best viewed when looking at the plot of the
results in Figure 13.3. In this way, you can relate the statistical outcomes
to a visual depiction of the means. Figure 13.18 presents the results of
the first set of simple effects comparing levels of
project
.Wearethus
comparing
simple
and
complex
for each style of leadership; with respect
to Figure 13.3, we are determining if each line significantly slants with
respect to the
x
axis.
Our results indicate that there is a statistically significant difference
for the authoritarian and laissez faire styles but not for the democratic