Information Technology Reference
In-Depth Information
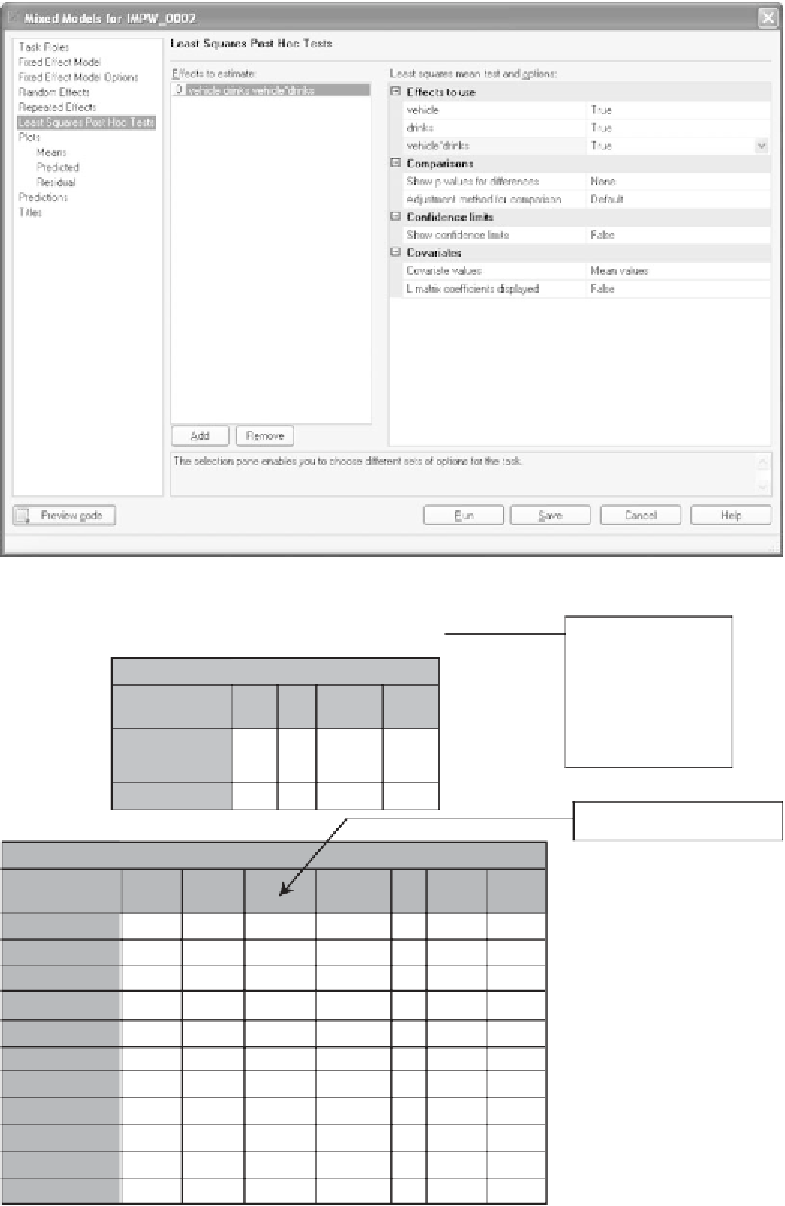
Figure 11.30
The
Least Squares Post Hoc Tests
window.
These
p
-values suggest
a nonsignificant
vehicle effect, a
significant drink
effect, and a
significant interaction
effect.
Type 3 Tests of Fixed Effects
Num
DF
Den
DF
Effect
Vehicle
Drinks
Drinks*Vehicle
F Value
Pr
>
F
1
2
2
5
10
10
2.66
75.35
8.16
0.1639
<
.0001
0.0079
Cell means for all conditions.
Least Squares Means
Standard
Error
Effect
Vehicle
Vehicle
Drinks
Drinks
Drinks
Drinks*Vehicle
Drinks*Vehicle
Drinks*Vehicle
Drinks*Vehicle
Drinks*Vehicle
Drinks*Vehicle
Drinks
Estimate
Pr
>
⏐
t
⏐
Vehicle
DF
t Value
1
2
4.1667
3.6111
1.1667
4.2500
6.2500
1.0000
1.3333
4.0000
4.5000
7.5000
5.0000
0.4437
0.4437
0.4753
0.4753
0.4753
0.5594
0.5594
0.5594
0.5594
0.5594
0.5594
5
5
10
10
10
10
10
10
10
10
10
9.39
8.14
2.45
8.94
13.15
1.79
2.38
7.15
8.04
13.41
8.94
0.0002
0.0005
0.0340
<
0
1
3
0
0
1
1
3
3
.0001
<.0001
0.1041
0.0384
<
1
2
1
2
1
2
.0001
<
.0001
<
.0001
<
.0001
Figure 11.31
The summary table and the descriptive statistics.