Information Technology Reference
In-Depth Information
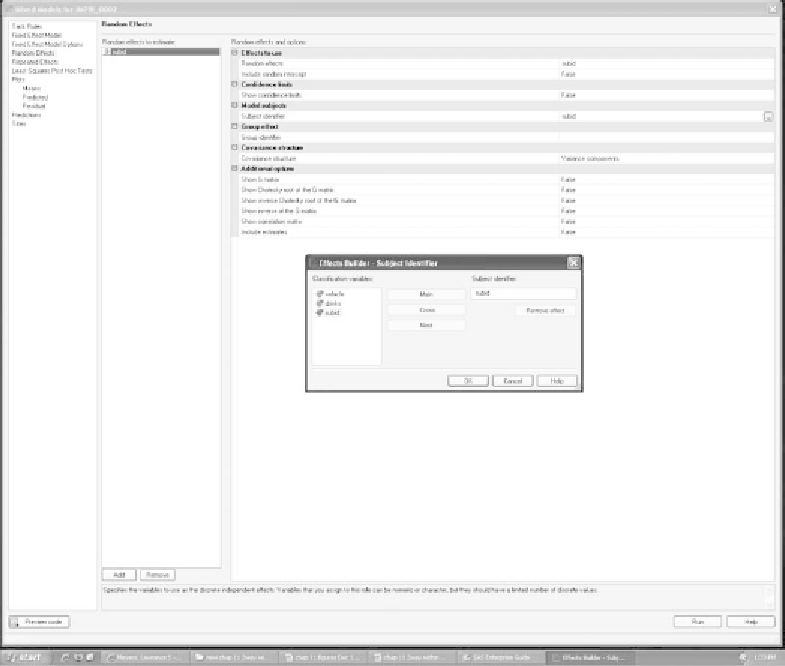
Figure 11.29
The
Model Subjects
panel in the
Random Effects
window.
click the
Main
pushbutton;
subid
will automatically appear in the
Subject
identifier
panel. Select the
OK
pushbutton. This is shown in Figure 11.29.
Select
Least Squares Post Hoc Tests
in the navigation panel. Click the
Add
pushbutton at the bottom of the
Effects to estimate
pane. The screen
shown in Figure 11.30 appears. Highlight
vehicle
under the
Effects to use
menu and a downward arrow will appear. Click on this arrow and a drop-
down menu will appear; select
True
.Repeatthisprocedurefor
drinks
and
drinks
∗
vehicle
. To perform the analysis, click the
Run
pushbutton.
11.12 SAS OUTPUT FROM THE OMNIBUS ANALYSIS
The bottom portion of Figure 11.31 presents the descriptive statistics for
the conditions. Because these are least squares means, we obtain the stan-
dard errors associated with the means rather than the standard deviation.
The top portion presents the summary table. The
F
ratios produced by
SAS Enterprise Guide
aresomewhatdifferentfromthoseproducedbySPSS
because of the differences in algorithms used to analyze within-subjects
variables (see Section 10.17), but they both permit us to draw comparable