Information Technology Reference
In-Depth Information
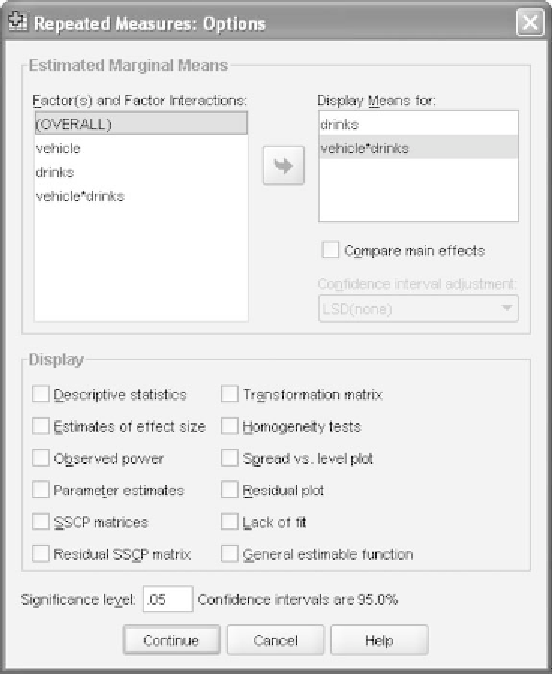
Figure 11.16
Two effects are brought into the
Estimated Margin Means
panel.
SPSS calls
Error
is the variance representing individual differences; it does
not calculate an
F
ratio for this effect.
11.9 PERFORMING THE POST-ANOVA ANALYSIS IN SPSS
11.9.1 DETERMINING THE EFFECTS TO BE SIMPLIFIED
Configure the analysis as you did for the omnibus ANOVA. In the
Options
dialog window shown in Figure 11.16, bring over the effects for
drinks
and the
vehicle
∗
drinks
interaction (the two significant effects) to the
panel labeled
DisplayMeans for
;thiswillproducealineof
/EMMEANS
=
TABLES
syntax and tables of estimated marginal means for these effects.
Do not ask for the
Descriptive statistics
- we already have obtained them
and the simple effects are performed on the estimated margin means
rather than the observed means in any case. Click
Continue
to reach the
main dialog window and then click the
Paste
pushbutton instead of click-
ing
OK
. The underlying syntax will then be placed in a syntax window;
locate that window on your desktop and make it active by clicking it.