Information Technology Reference
In-Depth Information
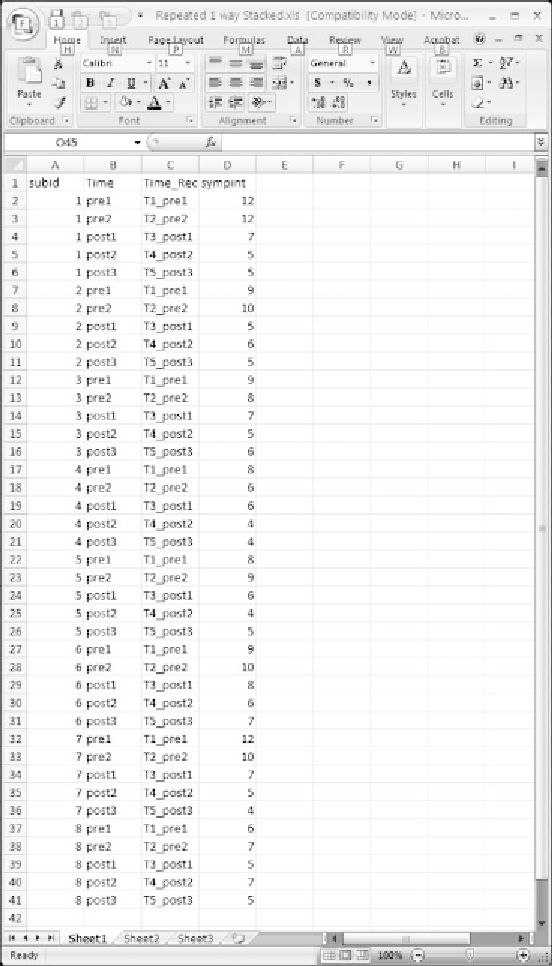
Figure 10.18
The Excel file containing the data in stacked format.
in alphabetic order in the output; our use of
T1
through
T5
will make
it easier for us to view the results (it does not change the data or the
results in any way). We will use this
Time_Recode
variable in the anal-
ysis instead of the
Time
variable. The last column, named
sympint
,is
the actual symptom intensity score of the participant under the specified
condition.