Information Technology Reference
In-Depth Information
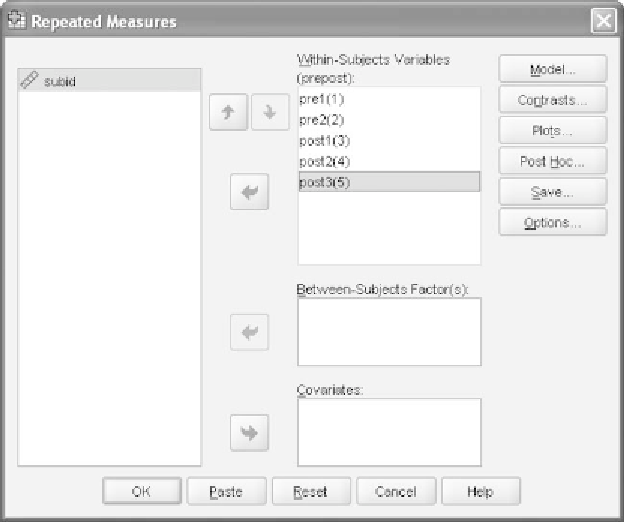
Figure 10.8
Main
GLM Repeated Measures
dialog window with our prepost within-
subjects variable now defined.
10.11.3 STRUCTURING THE OMNIBUS ANOVA
Click the
Options
pushbutton to reach the dialog window shown in
Figure 10.9. The top portion of the window is devoted to
Estimated
Marginal Means
. We will return to this option to perform our multiple
comparisons procedure if the effect of the treatment variable is statistically
significant. For now, our focus is on the omnibus ANOVA.
In the bottom portion of the window labeled
Display
,check
Descrip-
tive statistics
to output the observed means and standard deviations.
Click
Continue
to return to the main dialog window and
OK
to run the
omnibus analysis.
10.12 SPSS OUTPUT FOR THE OMNIBUS ANALYSIS
10.12.1 CODING AND DESCRIPTION
Figure 10.10 shows the
WithinSubjects Factors
table. It presents the levels
of the repeated measure with the value codes that SPSS has assigned to
each; it is a good way to verify that you have set up the analysis correctly.
These codes will be used by SPSS in presenting the paired comparisons
that we will ask for if we obtain a statistically significant effect of our
prepost
variable.
The descriptive statistics are presented in Figure 10.11. They include
the observed means, standard deviations, and sample sizes for each con-
dition.