Information Technology Reference
In-Depth Information
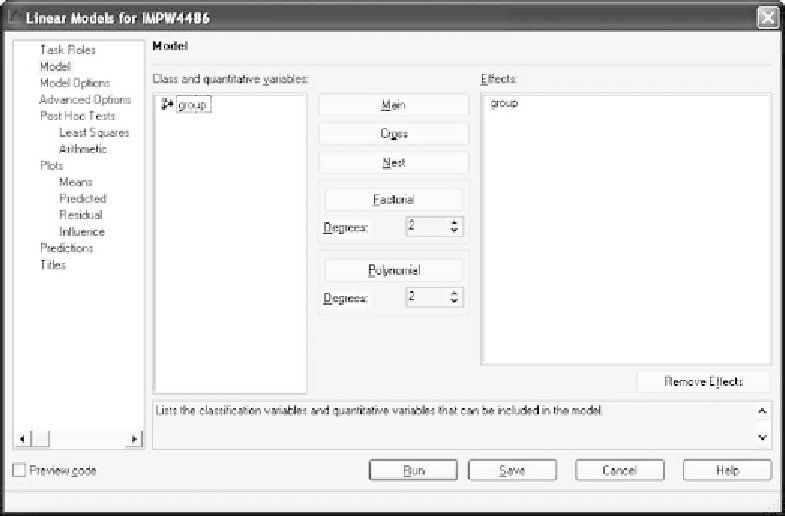
Figure 7.8
The
Linear Models Model
window.
On the
Model
tab, select
group
and click the
Main
bar in the middle
of the window. This will place
group
in the
Effects
panel as shown in
Figure 7.8.
As we did to perform the omnibus analysis, in the
Model Options
window click only the
Type III sum of squares to show
.Nowselect
Least
Squares
on the
Post Hoc Tests
tab and, when you reach that screen, click
the
Add
pushbutton. After Clicking the
Add
pushbutton, four drop-down
menus appear in the
Options formeans tests
pane as shown in Figure 7.9.
When the right-most portion of each horizontal panel is highlighted, a
drop-down menu appears, allowing you to choose an alternative to the
default that currently shows in the panel. Here is what needs to be done
to perform a Tukey post hoc test.
On the
Class effects to use
drop-down menu now showing
False
,
click
False
and the down arrow and select
True
.Thiswillfocuson
the differences of the means for the
group
variable.
On the
Comparisons
drop-down menu for
Show p-values for dif-
ferences
now showing
None
, click in the panel, then click the down
arrow, and select
All pairwise differences
.
On the
Comparisons
drop-down menu for
Adjustment method
for comparisons
now showing
Default
, click in the panel, then click
the down arrow, and select
Tuke y
.
On the
Show confidence limits
drop-down menu now showing
False
,click
False
and the down arrow and select
True
.Thiswill