Information Technology Reference
In-Depth Information
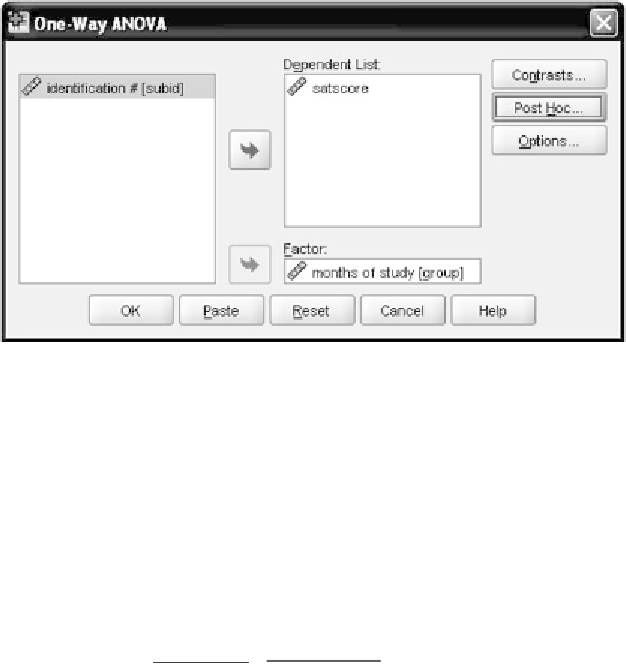
Figure 7.2
The main
One-Way ANOVA
window.
this with an asterisk in the matrix of differences. From this assessment, we
conclude that SAT scores were significantly higher as study time in months
increased, with the exception of no difference between the six month and
eight month study groups.
Another commonly used post hoc test was developed by Fisher (1935)
and is known as the
least significant difference
test (LSD). The rationale for
its use can be found in Carmer and Swanson (1973). The formula for the
LSD is as follows (the matrix of differences should be based on treatment
sums and not means):
F
(1,
df
S
/
A
)
2(
n
)(
MS
S
/
A
)
D
LSD
=
.
(7.6)
7.10 PERFORMING A TUKEY HSD TEST IN SPSS
The omnibus
F
ratio from our ANOVA was statistically significant, and
we are ready to determine where our group differences lie by using the
Tukey HSD
procedure available in the
Post Hoc
window in SPSS. Open
your data file. From the main menu, select
Analyze
➜
CompareMeans
➜
One-Way ANOVA.
That will bring you to the main dialog window for the
procedure as shown in Figure 7.2. Configure it as is shown in Figure 7.2
with
group
as the
Factor
and
satscore
in the
Dependent List
panel.
Click the
Options
pushbutton to reach the dialog window shown in
Figure 7.3. Select
Descriptive
but, with the prior analysis already per-
formed, there is no longer a need to run the Levene test. Click
Continue
to return to the main
One-Way ANOVA
window.
Now click the
Post Hoc
pushbutton to reach the list of the post hoc
tests available in SPSS. As shown in Figure 7.4, select
Tuke y.
Then click
Continue
and in the main window click
OK
to run the analysis.