Information Technology Reference
In-Depth Information
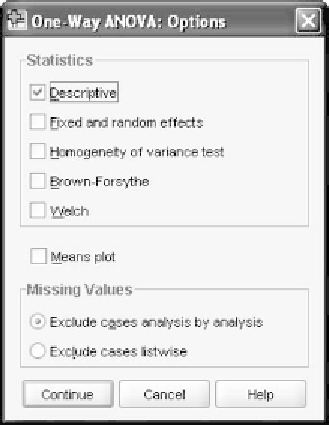
Figure 7.3
The
Options
dialog
window.
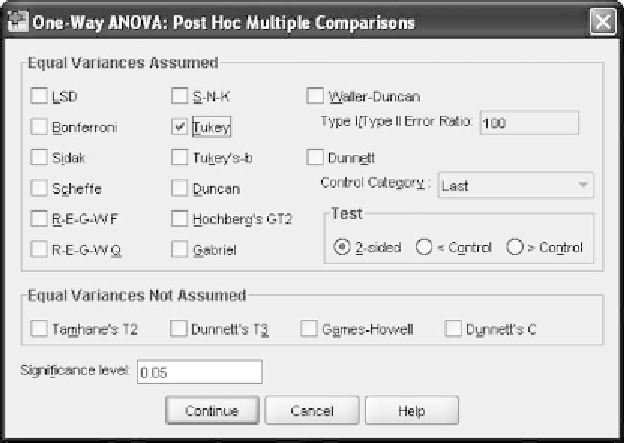
7.11 THE TUKEY HSD OUTPUT FROM SPSS
You have seen the overall ANOVA output in Chapter 6 and so we will go
directly to the results of the post hoc tests. Figure 7.5 shows the output
in a form known as
homogeneous subsets
,whichisaconvenientwayto
summarize the results of the Tukey pairwise comparisons. The means of
the groups are shown across the first five rows with the group names shown
at the far left. Each of the last four columns represents a homogeneous
subset.
Figure 7.4
The
Post Hoc
dialog window.