Information Technology Reference
In-Depth Information
ρ
||
,
Ohm·m
1000
166
km
134
km
100
30
km
155
km
94
km
147
km
39
km
10
58
km
123
km
110
km
T, s
1/2
0.1
1
10
100
- curves along the continental part of the Lincoln
line. The parameter of the curves is the distance to the coast
Fig. 12.55
Longitudinal apparent resistivity
the High Cascades, where low-frequency values of
ske
w
B
exceed 0.3. The azimuth
of the strike of the regional two-dimensional structures determined from the Bahr
decomposition varies from 0
◦
to 10
◦
. This agrees with orientation of tipper polar
diagrams and induction arrows at many points on the Lincoln line. As an illustration,
Fig. 12.58 shows the tipper polar diagrams for
T
=
2500 s and real induction arrows
for
T
6400 s. Within the Coast Range,the tipper diagrams are figures-of-eight
with their major axis oriented transversally or subtransversaly to the shoreline.
=
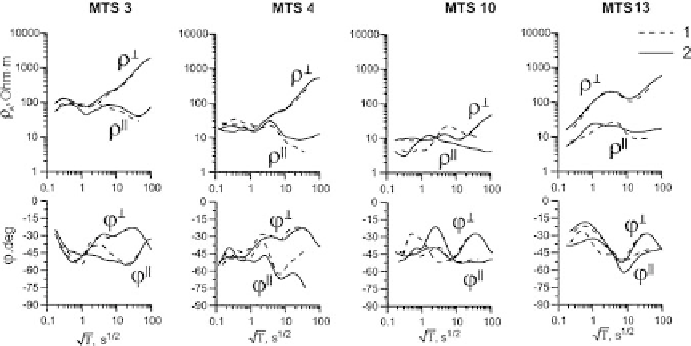
Fig. 12.56
Dispersion relations between apparent-resistivity
A
- curves and phase
- curves: 1-
observations, 2- dispersion transformation