Information Technology Reference
In-Depth Information
134
km
30
km
a
ρ
⊥
, Ohm·m
1000
7
km
147
km
94
km
58
km
123
km
100
166
km
110
km
72
km
155
km
10
T, s
1/2
0.1
1
10
100
b
7
km
ρ
⊥
, Ohm·m
30
km
48
km
72
km
94
km
110
km
1000
123
km
134
km
147
km
100
155
km
166
km
10
T, s
1/2
0.1
1
10
100
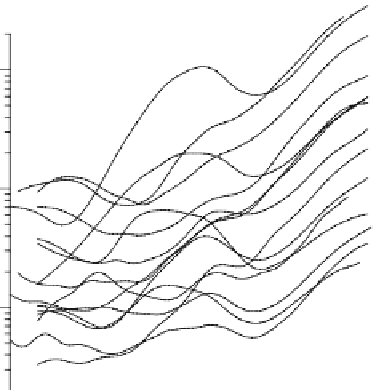
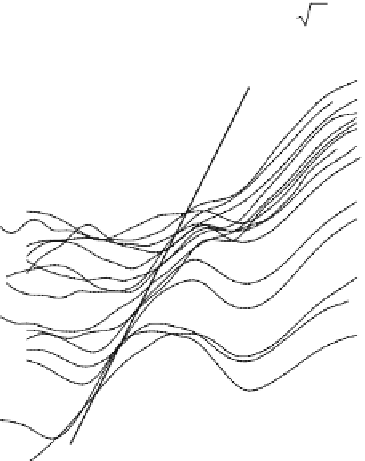
⊥
- curves along the continental part of the Lincoln line:
(
a
) observed curves, (
b
) normalized curves. The parameter of the curves is the distance to the coast
Fig. 12.54
Transverse apparent resistivity
parameter
N
varies from 0.1-0.2 in the Willamette Valley and High Cascades to 0.4
in the Coast Range and Western Cascades. At low frequentcy (
T
>
100 s),
N
increases
to 0.4 in the Willamette Valley and to 0.5-0.8 in the Coast Range and Cascades.
Large values of
N,
are associated, as a rule, with large values of
ske
w
S
(0.3-0.5)
and small values of
ske
B
(0.1-0.15). Thus, following Bahr, we can regard the deep
regional background of the Cascadia subduction zone as a two-dimensional. Deep
three-dimensional effects make itself evident only in the Willamette Valley and in
w