Geoscience Reference
In-Depth Information
in each region, reconsider the mechanisms controlling
NADW reinitiation, and finally, discuss the role of each
NADW formation region in the simulated AMOC recovery
and overshoot.
increase in salinity is accompanied by warming, but here it is
clear that densification of North Atlantic upper layers is
controlled more by salinity than temperature. Figure 7 pro-
vides another more detailed T-S evolution of upper layers
in the Labrador Sea and GIN seas to support the salinity
control over potential density change. During the periods of
meltwater discharge and recovery, the changes of salinity,
both for the Labrador Sea and GIN seas, not only contribute
to the change of potential density but also compensate the
opposite effect of temperature.
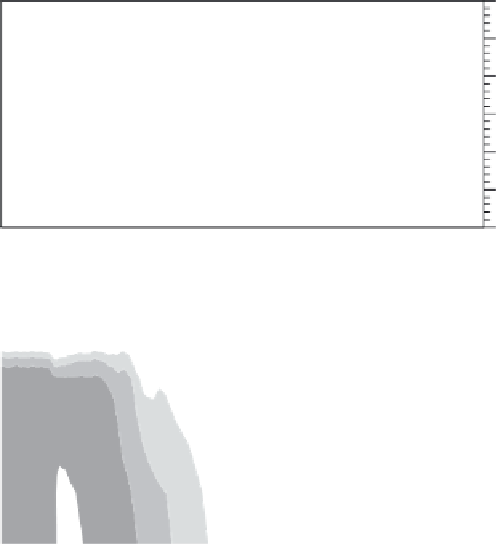
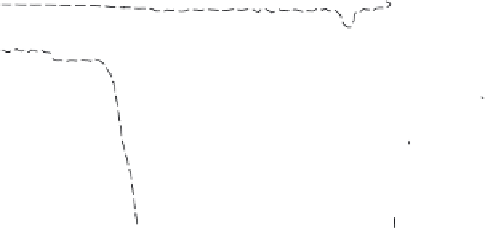
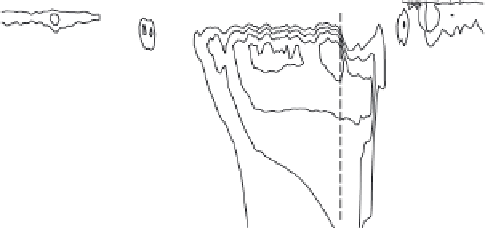
A Hovmöller diagram of area mean salinity and tempera-
ture in the Labrador Sea (Figure 8) shows that during the
meltwater discharge period (from 19 to 14.67 ka), the Labra-
dor Sea was freshened in all depths, with significant subsur-
face warming. The warming and freshening signal is mostly
inhibited in upper layers (about 0
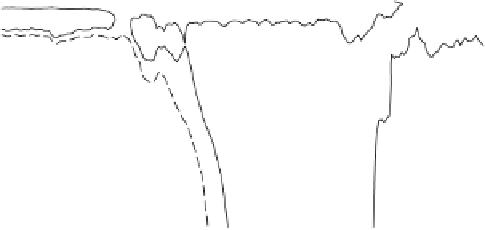
4.1. Evolution of Salinity/Temperature/Potential Density
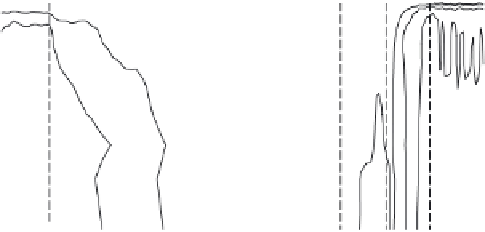
Figure 6 shows the temperature-salinity (T-S) diagram of
North Atlantic upper layers (0
800 m) at GLA, pre-BA,
REC, and BA. Generally, the northward increase of potential
density within upper ocean layers is controlled more by the
temperature gradient than salinity north of 30°N. However,
comparing the four consecutive ocean states, the change of
potential density during meltwater discharge (GLA to pre-
BA) and recovery periods (pre-BA to REC in the Labrador
Sea and REC to BA in the GIN seas) is mainly controlled by
salinity. During stage 1 (black line to light shaded line),
salinity and potential density in the whole North Atlantic
(excluding the tropical region) signi
-
800 m) through suppressed
convection, while turbulent mixing slowly spread the fresh-
ening and warming subsurface water to deeper layers. When
meltwater discharge is terminated at 14.67 ka, convection in
the Labrador Sea is quickly reinitiated, characterized by the
sharp downward penetration of freshened water and the re-
lease of stored subsurface heat. The depth affected by the
-
cantly increase, espe-
cially for the subtropical North Atlantic. During stage 2 (light
shaded line to medium shaded line), salinity and potential
density changes mainly happen in the GIN seas. Usually, an
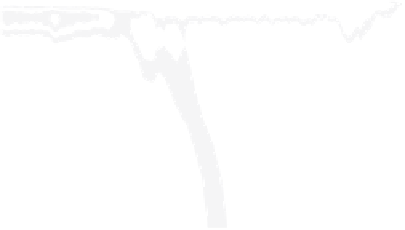
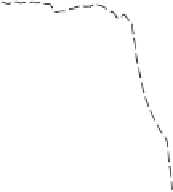
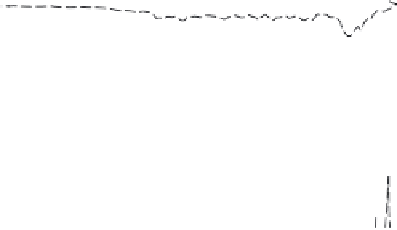
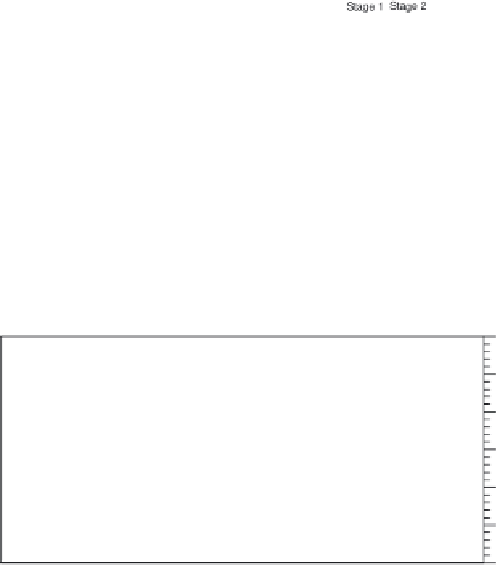
Figure 9.
Hovmöller diagram of (a) annual mean salinity (S) and (b) temperature (T) in the GIN seas, averaged between
62°N and 80°N.


Search WWH ::

Custom Search