Geoscience Reference
In-Depth Information
the Irminger Sea is included with the GIN seas to avoid a too
complex discussion. Changes in these three variables are
seen primarily around the Labrador Sea during stage 1 and
around the GIN seas during stage 2. It is clear that sea ice
cover is tightly connected with the increasing SST (Figure 2)
in both NADW origins and similarly with oceanic heat loss
and convection.
In Figure 4, SAT increases within nearly the whole North-
ern Hemisphere during stage 1, with a maximum about 15°C
around the Labrador Sea during stage 1, and then the warm-
ing center moves to the GIN seas during stage 2.
In Figure 5, we see that the zonal mean salinity/temper-
ature/potential density of the whole Atlantic Basin exhibits
a simultaneous shift, with salinization/warming/densifica-
tion of upper layers and the opposite change in deeper
layers. This primarily happens in the Labrador Sea during
stage 1 and then moves to the GIN seas during stage 2. An
exception to these simultaneous shifts in ocean conditions
is the subtropical North Atlantic, where Ekman pumping
becomes a significant factor. Ekman pumping drives the
recovered northward warm and salty water of upper layers
to the depth of about 500 m, that is why the maximum
change of salinity and temperature at the depth of 500 m in
Figure 5, also for the SSS and SSD change in Figure 2,
occurs during stage 1 in the subtropical North Atlantic. A
more detailed discussion of salinity/temperature/potential
density evolution within the two main NADW origins will
be the topic of the following section.
The two-stage feature of AMOC recovery becomes appar-
ent through an analysis of NADW formation by region, and
it is con
rmed by the associated ocean and atmosphere
variables. Even though the overall evolution of AMOC in-
tensity lacks an obvious two-stage feature, our regional anal-
ysis shows that a two-stage feature exists in the simulated
recovery process of AMOC during the last deglaciation.
4. CAUSES OF TWO-STAGE AMOC RECOVERY
The preceding analysis suggests the two-stage evolution of
AMOC recovery depends on the asynchronous reinitiation of
NADW in the Labrador and GIN seas, but we have yet to
determine the reasons for this asynchronicity. In this section,
we present the time evolution of salinity/temperature/poten-
tial density, give a detailed account of deepwater formation
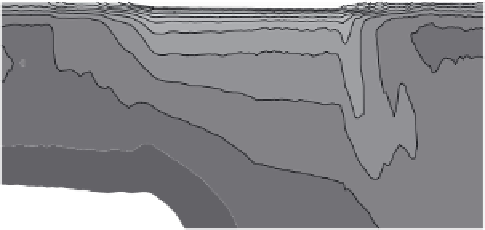
Figure 8.
Hovmöller diagram of (a) annual mean salinity (S) and (b) temperature (T) in the Labrador Sea, averaged
between 50°N and 62°N.


Search WWH ::

Custom Search